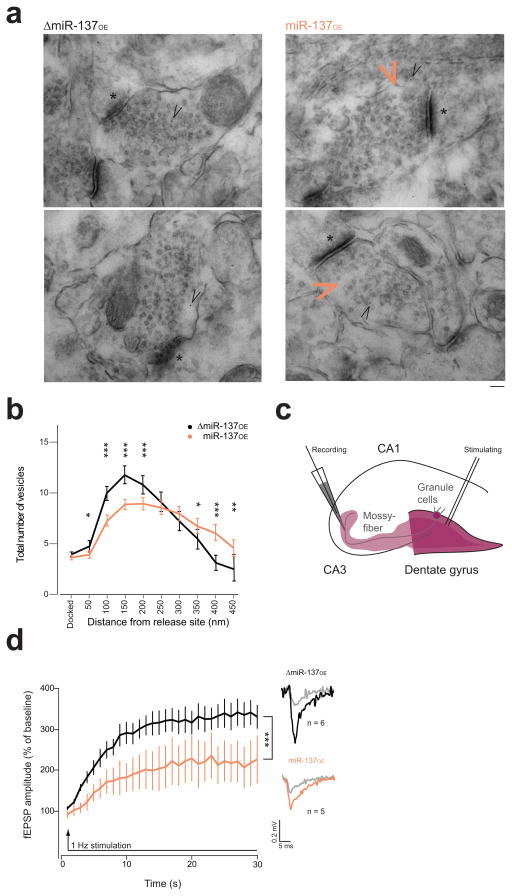
Figure 3. Morphological and functional alterations are evident at the mossy fiber synapse of miR-137OE.
(a,b) Ultrastructural analysis of the mossy fiber presynaptic terminal. (a) Representative images of virus-transduced synapse. Black arrowhead, gold-particles labeling mCherry; orange arrowhead, gap in the vesicle pool in miR-137OE synapse; *, active zone; scale bar, 100 nm. (b) Vesicle distribution for ΔmiR-137OE (black, n = 84) and miR-137OE (orange, n = 112), V = 0.26, F(11,184) = 5.81, ***P < 0.001; with post hoc analysis shown: FDocked(1,194) = 2.91, nsP = 0.0892; F50nm(1,194) = 6.83, *P = 0.0097; F100nm(1,194) = 37.7, ***P < 0.001; F150nm(1,194) = 32.5, ***P < 0.001; F200nm(1,194) = 12.4, ***P < 0.001; F250nm(1,194) = 0.87, nsP = 0.3517; F300nm(1,194) = 1.57, nsP 0.211; F350nm(1,194) = 4.00, *P = 0.0471; F400nm(1,194) = 27.3, ***P < 0.001; F450nm(1,194) = 7.46, **P = 0.0069; n, number of analyzed synapses of at least three animals. (c) Schematic overview of the electrophysiological paradigm for acute hippocampal slice recording; magenta, presumptive mCherry virus expression. (d) fEPSP amplitude for 1-Hz sustained stimulation, H(1) = 67.34, ***P < 0.001. Representative traces embedded; gray traces, response to first stimulation; n, number of analyzed hippocampal slice preparation from at least three animals. ns, not significant. Error bars, s.e.m, V, multivariate analysis of variance.

