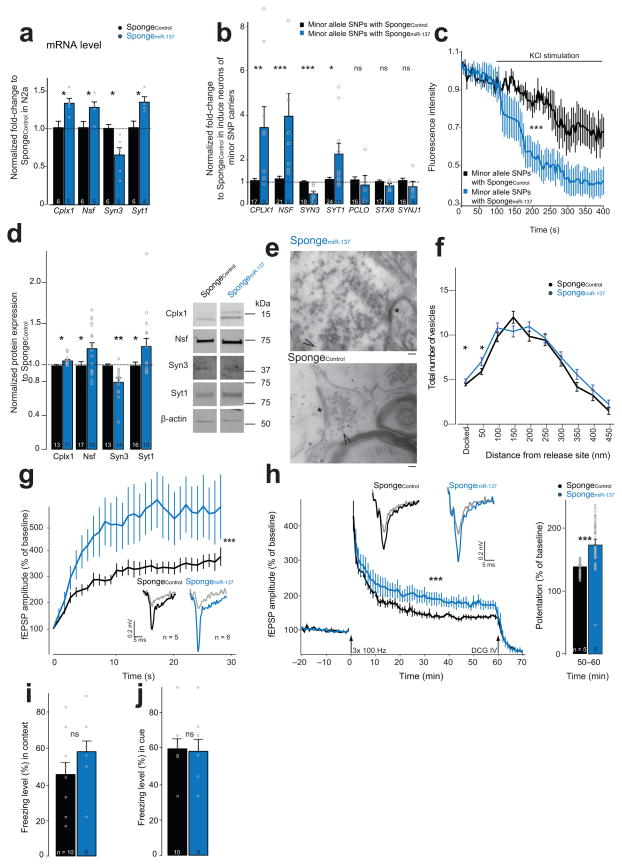
Figure 5. Sequestration of endogenous miR-137 leads to phenotype reversal. SpongeControl (black), SpongemiR-137 (blue).
(a) Relative mRNA levels of miR-137 target genes in transfected N2a cells, tCplx1(8.80) = 3.02, *P = 0.0149, r = 0.71; tNsf(2.46) = 9.00, *P = 0.036, r = 0.64; tSyn3(7.70) = −3.24, *P = 0.0125, r = 0.76; tSyt1(7.96) = 3.00 *P = 0.0173, r = 0.73; n, number of experiments. (b) Relative mRNA levels in transduced induced minor allele SNP neurons, WCPLX1 = 27, **P = 0.0064, r = −0.53; WNSF = 13, ***P < 0.001, r = −0.70; WSYN3 = 117, ***P < 0.001, r = −0.71; WSYT1 = 66.5 *P = 0.0209, r = −0.39; tPCLO(4.82) = 0.52 nsP = 0.6282, r = 0.23; tSTX8(5.63) = 1.54 nsP = 0.1782, r = 0.54; tSYNJ1(5.56) = 1.06 nsP = 0.3338, r = 0.41; SpongeControl, n = 11; SpongemiR-137, n = 18; number of transduced minor allele SNP fibroblast lines with either construct from three reprogramming. (c) FM4-64 imaging analysis, H(1) = 152.06, ***P < 0.001; n, number of analyzed transduced induced neurons of the two minor allele fibroblast lines from three reprogramming. (d) miR-137 target genes protein level in mossy fiber-CA3 pathway, tCplx1(21.97) = −2.69, *P = 0.0140, r = 0.5; t Nsf(29.0) = −2.36, *P = 0.0251, r = 0.40; tSyn3(16.11) = 3.43, **P = 0.0034, r = 0.65; tSyt1(21.41) = −2.17, *P = 0.0415, r = 0.42; n, number of dissected dorsal DG-CA3 regions from at least three animals. Right, cropped western blot image. Full-length blots are presented in Supplementary Figure 9. (e,f) Ultrastructural analysis of mossy fiber presynaptic terminal. (e) Representative images of virus-transduced synapse labeled with gold particles (arrowhead); *, active zone; scale bars, 100 nm. (f) Vesicle distribution from the synaptic release site for SpongeControl (n = 50) and SpongemiR-137 (n = 43), V = 0.25, F(11,91) = 2.40, *P = 0.0125, post hoc analysis: FDocked(1,91) = 4.01, *P = 0.0483; F50nm(1,91) = 4.13, *P = 0.045; F100nm(1,91) = 1.68, nsP = 0.1977; F150nm(1,91) = 3.04, nsP = 0.0845; F200nm(1,91) = 2.18, nsP = 0.1429; F250nm(1,91) = 0.09, nsP = 0.7687; F300nm(1,91) = 0.29, nsP = 0.5886; F350nm(1,91) = 3.22, nsP = 0.0759; F400nm(1,91) = 0.55, nsP = 0.4619; F450nm(1,91) = 1.53, nsP = 0.2188; n, number of analyzed synapses from at least three animals. (g) fEPSP amplitude for 1 Hz sustained stimulation, F(1,305) = 77.73, ***P < 0.001. Representative traces embedded; gray trace, response to first stimulation; n, number of analyzed hippocampal slices from at least three animals. (h) LTP recording in DG-CA3 mossy fiber pathway, H(1) = 125.92, ***P < 0.001. Arrows, application of either high frequency stimulation or DCG-IV. Inset, representative fEPSP traces; gray traces, baseline before stimulation. Right bar chart, LTP magnitude for the last 10 min (50–60 min) recording, W = 341, ***P < 0.001, r = −0.67; n, number of analyzed hippocampal slices from at least three animals. (i,j) Fear conditioning. Freezing percentage for context (i; t(17.0) = −1.43, nsP = 0.1707, r = 0.33) and cue (j; t(16.21) = 0.16, nsP = 0.873, r = 0.04). n, number of animals. ns, not significant. Error bars, s.e.m.

