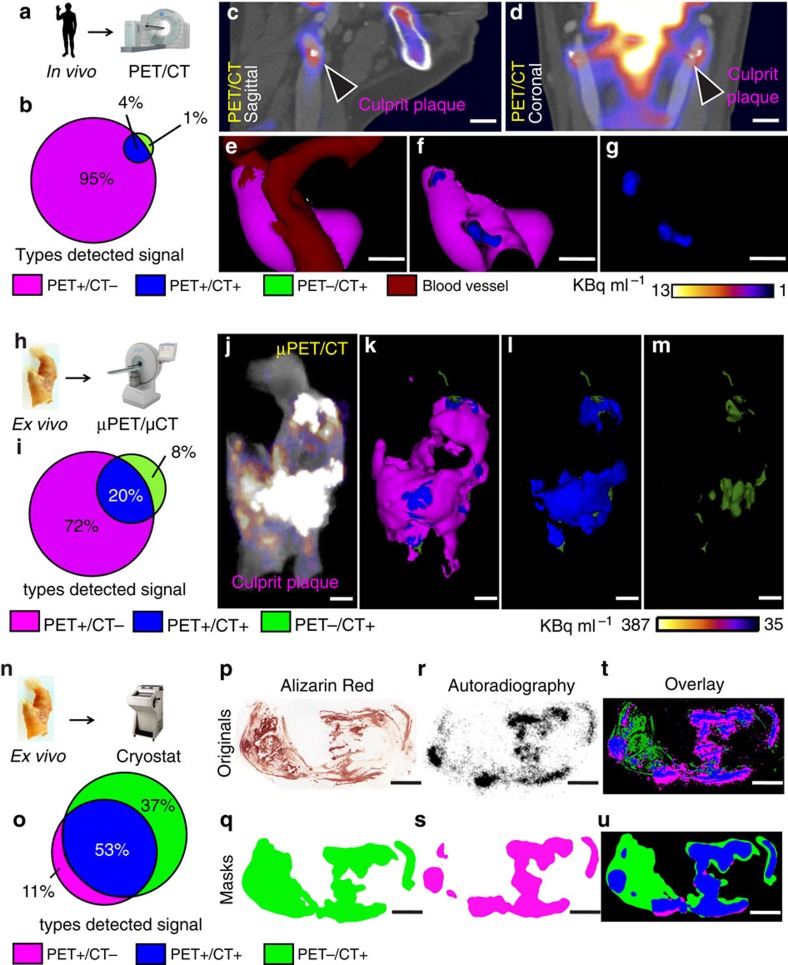
Figure 4. High-resolution imaging reveals specificity of 18F-NaF binding to vascular calcification.
(a) Four symptomatic patients underwent clinical PET/CT imaging after injection of 18F-NaF and before carotid endarterectomy. (b) Comparison of PET and CT signals. Although clinical PET spatial resolution is much less than CT, PET detects larger area than CT, demonstrating higher sensitivity. PET+/CT−: magenta, 95%, PET+/CT+: blue, 4%, PET−/CT+: green, 1%. (c,d) Clinical PET/CT scan with the culprit atheroma (arrowheads). Scale bar, 11 mm (c) Sagittal view; (d) Coronal view. (e–g) Analysis of the carotid in vivo, where PET signal (magenta) was detected using observer-independent Otsu histogram-based thresholding. PET signal is co-localized with CT vascular calcification (blue). CT-detected soft tissue is dark red. Scale bar, 7 mm. (h) After endarterectomy, carotids were recovered, incubated in 18F-NaF and scanned in a μPET/μCT scanner. (i) Ratio of PET+/CT− area and CT+ signals is smaller than in b, due to the higher μPET resolution, which results in more precise signal detection. PET+/CT−: magenta, 72%, PET+/CT+: blue, 20%, PET−/CT+: green, 8%. (j–m) Ex vivo images of the carotid from the same patient as in c–g. (j) μPET/μCT image without thresholding; (k–m) 3D thresholded μPET/μCT images. μPET signal (magenta), PET+/CT+ (blue), PET−/CT+ (green). (n) After μPET/μCT scan, carotids were incubated in 18F-NaF and sectioned on cryostat. (o) Ratio between PET+/CT− and CT+ regions indicates an even higher PET+/CT− resolution. PET+/CT−: magenta, 11%, PET+/CT+: blue, 53%, PET−/CT+: green, 37%. (p) Carotid from the same patient as in c–g, j–m. Alizarin Red detects both macro- and microcalcifications with the highest precision of all methods described here. (q) Alizarin Red image after Gaussian filter and Li thresholding, to match resolution to autoradiography image. (r) Autoradiography shows highly specific binding to all microcalcifications, but is not able to penetrate the deeper levels of macrocalcifications. (s) Autoradiography image after Gaussian filter and Li thresholding, to match resolution to the filtered Alizarin Red image. (t) Overlay of unfiltered histology and autoradiography images showing a high PET+/CT− signal, due to mismatch in resolution. (u) Overlay of filtered histology and autoradiography images shows matching signal resolution. Scale bar=3 mm. 3D movies in Supplementary Data.

