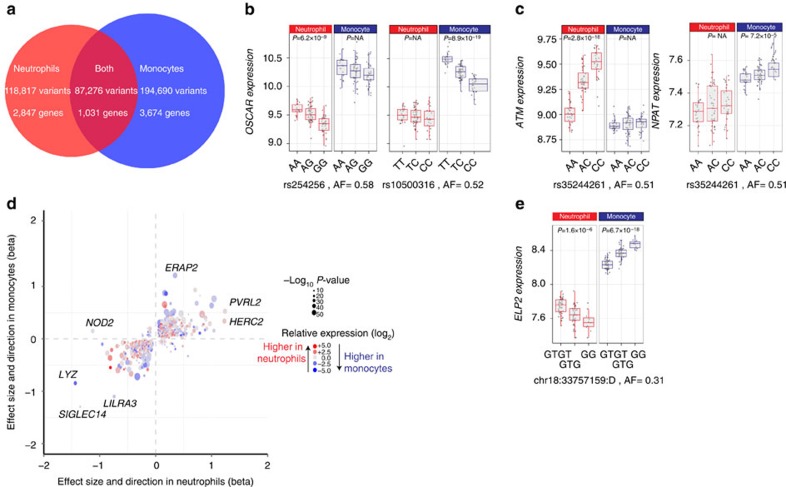
Figure 3. Shared and cell-type-specific cis-eQTL in neutrophils and monocytes.
(a) Venn diagrams showing the number of variants and genes with cis-sQTL by cell type. Examples of cell-type constraint include (b) independent variants associated with expression of the same gene, OSCAR, specific to either neutrophils or monocytes (lead eSNPs rs254256 and rs1050031, respectively, r2<0.02). Conversely, (c) a single variant may be associated with different genes in each cell type as shown for rs35244261 (associated with elevated expression of ATM in neutrophils, and NPAT in monocytes). (d) Amongst 1,939 genes that have an eQTL in both cell types, 1,031 involve the same variant and are plotted with the effect size in neutrophils and monocytes (shown on x- and y axes, respectively). Colour denotes the relative expression in neutrophils and monocytes, and size denotes the minimum P-value of an eQTL for that gene. Several eQTL show divergent direction of effects on the gene they regulate including NOD2, THBD, TSTD1, TOM1L2 and ELP2 (latter shown in e). Genes with large effect sizes are highlighted, including HERC2, the gene responsible for iris colour, which has amongst the most significant eQTL of all genes in neutrophils. P-values >0.05 are denoted as P=NA. Box lower and upper border denote 25th and 75th centiles, respectively, central line denotes median and whiskers extend to 1.5 × IQR. In all cases 101 donor replicates shown.

