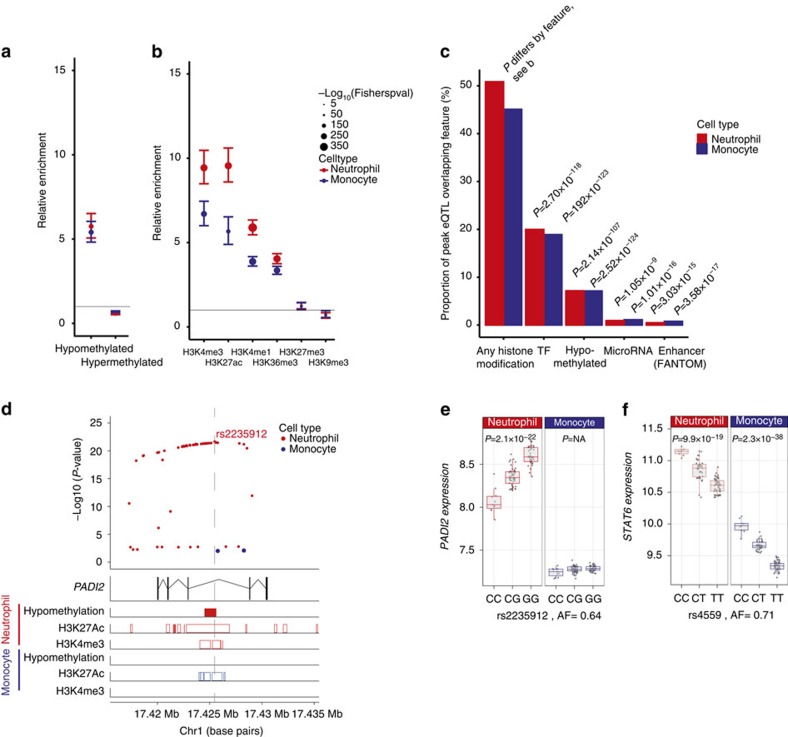
Figure 4. Epigenetic basis of eQTL in neutrophils and monocytes.
We integrated eQTL data with whole-genome bisulfite sequencing and chromatin-immunoprecipitation sequencing data from primary neutrophils and monocytes from 4 to 8 individuals from the BLUEPRINT Consortium. (a) Enrichment of cis-eQTL in neutrophils and monocytes, in hypo- and hypermethylated regions of the genome in concordant cell types relative to all SNP’s tested for eQTL. (b) Enrichment of neutrophil and monocyte cis-eQTL relative to all variants tested for colocalisation in regions of the genome associated with modified histones based on ChIP-Seq of modified histones in neutrophils and monocytes. (c) Proportion of cis-eQTL in neutrophils (n=3,774) and monocytes (n=4,668) that overlie modified histones in the concordant cell type (BLUEPRINT), transcription factor binding sites in cell lines (ENCODE), sites that are hypomethylated in the concordant cell type (BLUEPRINT), target sites of conserved miRNAs with high mirSVR scores (microRNA.org) or CAGE-seq defined enhancer sites in neutrophils and monocytes (FANTOM5). Note that an eQTL may overlap more than one feature. (d,e) An example of a cell-type-specific eQTL possibly attributable to methylation differences in cell types is rs2235912, a site which is in an intron of PADI2 that is hypomethylated in neutrophils but not monocytes. This locus is marked by the activating histone marks H3K27Ac and H3K4me3 in neutrophils but in monocytes has a smaller region marked by H3K27Ac only. As shown in e, the gene is more highly expressed in neutrophils than monocytes, perhaps due to the greater activating histone marks in neutrophils. The G allele creates an additional putative CpG site, which may explain the allele being associated with higher PADI2 expression relative to the C allele. (f) STAT6 is an example of a gene with an eQTL in both monocytes and neutrophils where the eQTL lies in a predicted binding region for mir-18b, a microRNA. Tails in a,b show 95% CI of the enrichment estimate. In e,f, box lower and upper border denote 25th and 75th centiles, respectively, central line denotes median and whiskers extend to 1.5 × IQR. In all cases 101 donor replicates shown. P-values >0.05 are denoted as P=NA.

