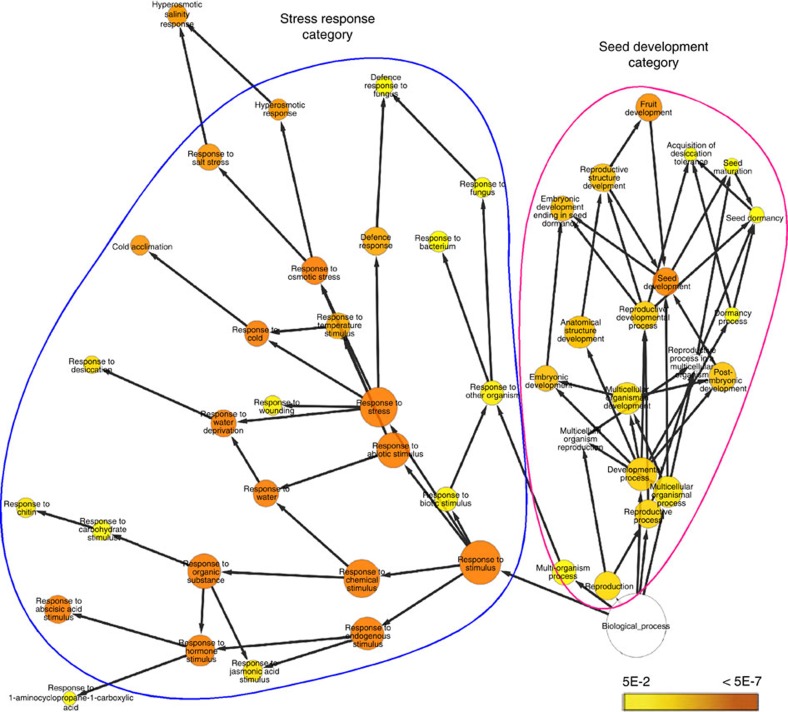
Figure 5. Over-represented gene ontology (GO) categories among genes upregulated in scl15 mutant seedlings.
BiNGO analysis representing over-represented categories of the ontology Biological Process among the genes that are more than threefold (Student's t-test (P≤0.05) from three biological replicates with a Benjamini-Hochberg false discovery rate of 0.05) upregulated in the scl15-1 mutant plants compared with the wild type. The two most over-represented GO categories ‘seed development' and ‘stress response' are shown. Coloured nodes ranging from yellow to dark orange represent the levels of significance of the over-represented GO terms with P values from 5E-2 to 5E-7 (Hypergeometric test and a Benjamini–Hochberg P-value correction for multiple comparisons34,63).

