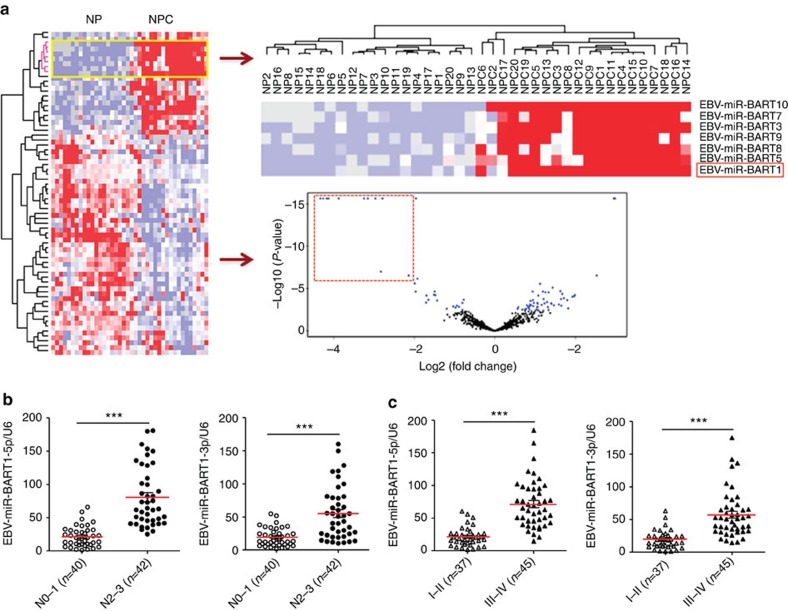
Figure 1. EBV-miR-BART1 is highly expressed in NPC and associated with clinicopathological features.
(a) MiRNA expression profile microarray screening. Supervised hierarchical cluster analysis of 69 miRNAs that were differentially expressed between 20 NPC and 20 NP biopsies (universal test P<0.005, fold-change >1.5, false discovery rate <0.05). Left: heatmap of the 69 miRNAs differentially expressed between NPC and NP samples. Red represents upregulated miRNAs and blue for downregulated miRNAs. Right-up: the top seven upregulated EBV BART miRNAs clustered together. Right-down: a volcano plot for the visualization of differentially expressed miRNAs with significance cut off P<0.005 and fold-change ≥1.5 symmetrically in NPC compared with NP. The top 11 upregulated EBV BART miRNAs in NPC were highlighted by a red dot-line square. (b) EBV-miR-BART1 was highly expressed in late pathological stages of NPC. The expression of EBV-miR-BART1 in a separated cohort of 82 NPC samples was determined by qRT–PCR. RPU6B was used for normalizing the expression of BART1-5p or BART1-3p. Student's t-test, mean±s.e.m., *P<0.05, **P<0.01. (c) EBV-miR-BART1 was highly expressed in advanced clinical stages of NPC. Both BART1-5p and BART1-3p were highly expressed in advanced clinical stages (III–IV) compared with that of early clinical stages (I–II). Student's t-test, mean±s.e.m., *P<0.05, **P<0.01.

