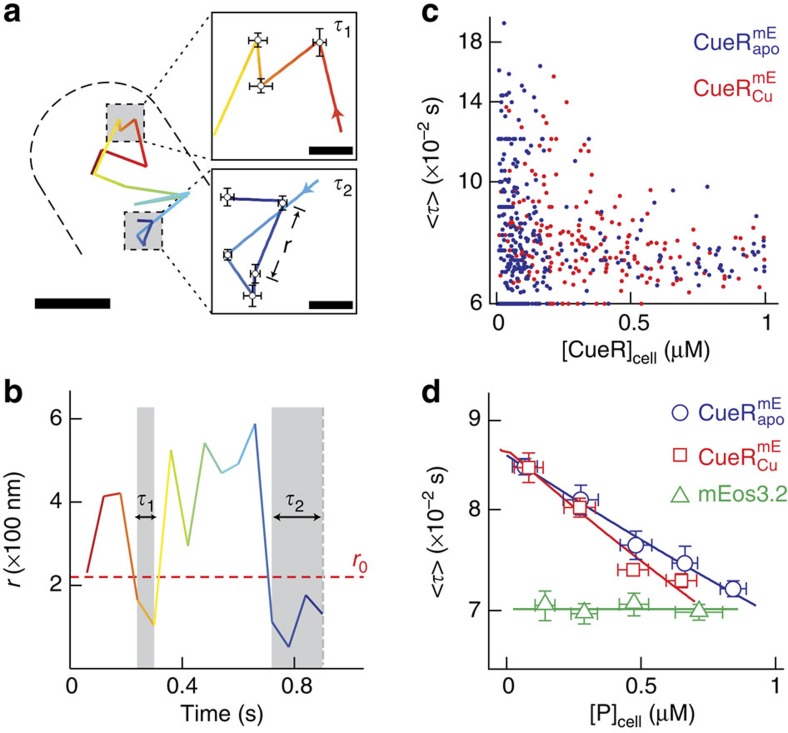
Figure 1. Protein-concentration-dependent residence time of CueR and ZntR on chromosome from stroboscopic single-molecule tracking in living E. coli cells.
(a) Position trajectory of a  molecule in a living cell. Dash line is the cell boundary. Zoom-in insets: locations (that is, residence sites) associated with the two residence times in b. Displacement r per time-lapse is the distance the molecule travelled between two consecutive images as shown in the τ2 inset. Scale bars in a and in the insets are 500 nm and 80 nm, respectively. (b) Displacement r per time-lapse (Ttl=60 ms) versus time trajectory for the molecule in a. τ1 and τ2, whose lengths are denoted by grey shades and double-headed arrows, are two microscopic residence times thresholded by r0=220 nm (horizontal red dashed line). (c) Correlation of average residence time 〈τ〉 and total protein concentration in each cell for
  and
and  from ∼450 and 250 cells containing a total of ∼12,000 and 10,000 molecules, respectively. (d) Dependence of 〈τ〉 on cellular protein concentration for
  ,
,  or free mEos3.2 as a control. 〈τ〉 of individual cells from c are grouped every ∼150 nM along the x-axis by their cellular protein concentrations and averaged within each group. Note 1 nM corresponds approximately to one protein molecule per cell volume (about 1.5 fL). The solid lines are empirical fits with 〈τ〉=(a[P]cell+b)−1 (Supplementary Note 8), except for mEos3.2, for which the line is a horizontal eye guide. x, y error bars are s.d. and s.e.m., respectively. Relevant data for
  and
and  are in Supplementary Figs 16 and 19.

