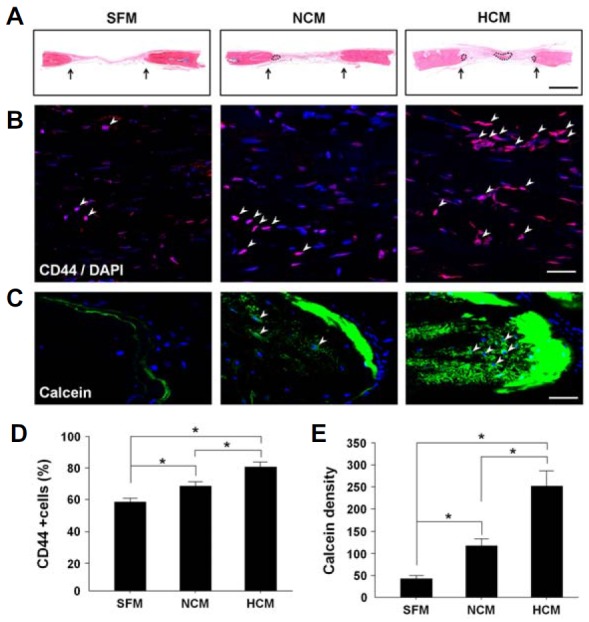
Fig. 5.

Histological analysis of regenerated bone tissue after treatment of CM into calvarial bone defect model in vivo. (A) H&E staining: arrows indicate the edges of the host bone, and dotted lines indicate reconstructed bone tissue. (B) Immunostaining of CD44: endogenous MSCs were visualized by anti-CD44 antibody labeling in the mineralized bone. (C, D) Calcein fluorochrome-based staining: the newly formed cells in the calvarial defect area are presented. Scale bar, 50 μm. Data are expressed as the mean ± SD, *P < 0.05.
