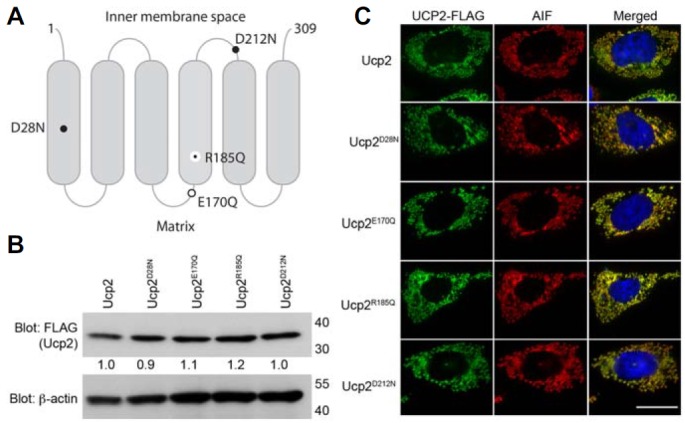
Fig. 2.

Subcellular localization of the Ucp2 mutants. (A) Schematic diagram of Ucp2 illustrating the positions of Ucp2 mutations. Large black dot, proton leak mutations; open circle, chloride transport mutation; small black dot, nucleotide-binding mutation. (B) LR73 cells were transfected with the indicated plasmids, lysed, and protein expression analyzed by immunoblotting. The expression of Ucp2 and mutated Ucp2 proteins were detected by immunoblotting. β-actin was used as a loading control. The numbers under the FLAG blot indicate relative expressions of the proteins to Ucp2. (C) LR73 cells, expressing the indicated proteins, were stained with anti-FLAG and AIF antibody. Scale bar, 20 μm.
