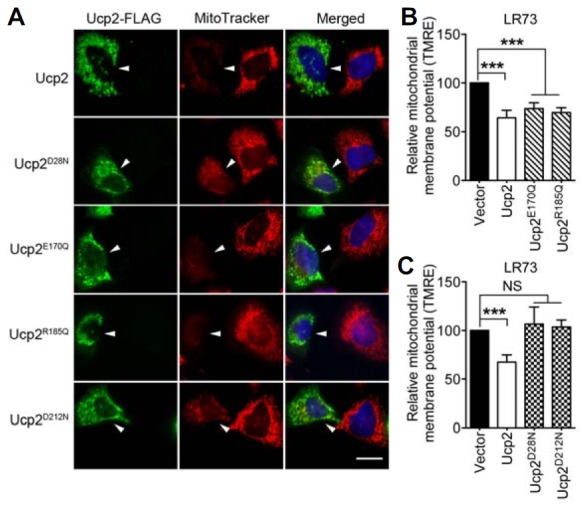
Fig. 3.

The effects of the Ucp2 mutants on the mitochondrial membrane potential. (A) LR73 cells, expressing the indicated proteins, were stained with anti-FLAG antibody and MitoTracker. The arrowheads point to the cell expressing Ucp2-FLAG. Scale bar, 20 μm. (B, C) LR73 cells were transfected with the indicated plasmids and then stained with TMRE. Mean fluorescence intensity of TMRE was measured by flow cytometry and compared to that of control cells transfected with empty vectors. NS, not significant; ***P < 0.001.
