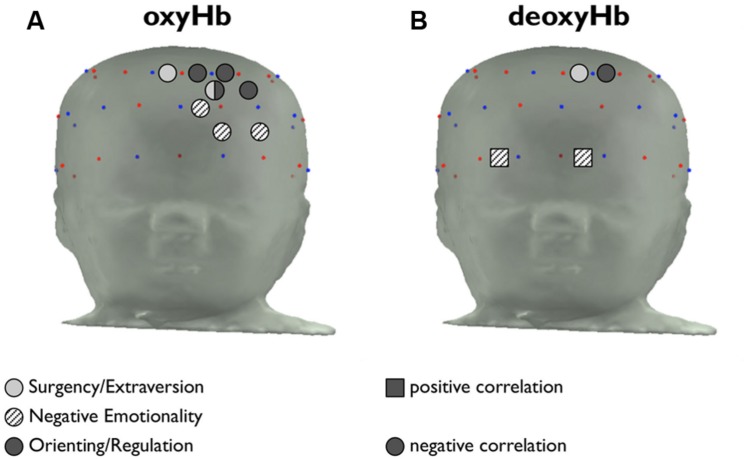
FIGURE 4.
Placement of channels in which temperament is correlated with hemoglobin activity. (A) Channels in which the maximum change in amplitude from baseline of [oxyHb] is significantly correlated with S/E, NE, and O/R are indicated in light gray, patterned, and dark gray, respectively. Positive correlations are indicated with a square marker, and negative correlations are indicated with a circular marker. (B) Channels in which maximum change in amplitude from baseline of [deoxyHb] is significantly correlated with temperament factors.

