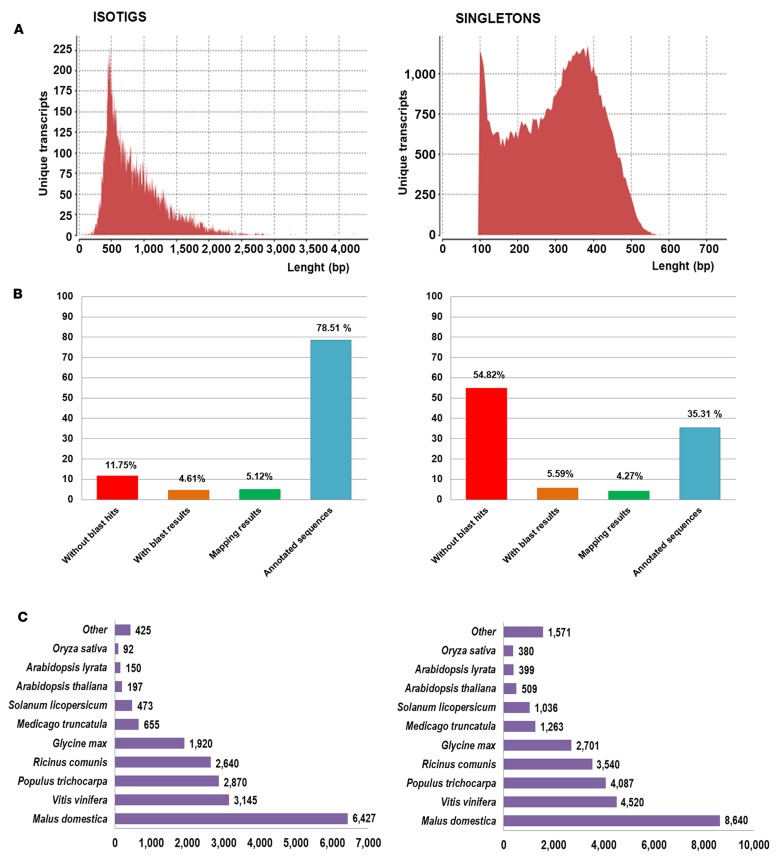
FIGURE 1.
Sequence length and blast results distribution for isotigs and singletons. (A) Sequence length distributions for unique transcript identified after assembly (B) Proportion of Ulmus minor transcript without homology with plant proteins (without blast hits), with homology but no associated function (with blast results), with Gene Ontology (GO)-terms but not significantly associated (mapping results) and with GO-terms significantly associated (annotated sequences). (C) Best blast hit species distribution with number of transcript identified for each species.

