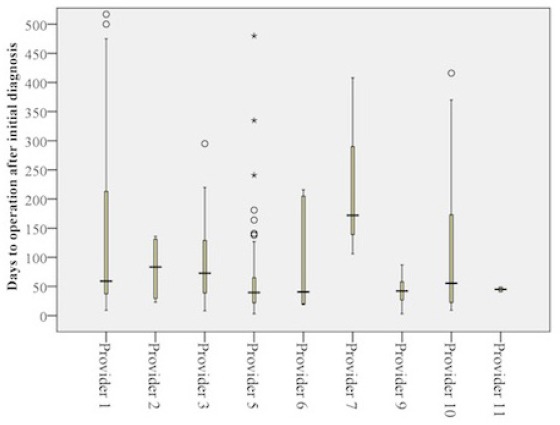
Figure 2.

A box plot displays the substantial difference in distribution of time to operation among providers. Median and interquartile range (IQR) of the time elapsed from diagnosis to surgery is well demonstrated for each provider. Providers 4 and 8 with no subsequent surgery were excluded from the box plot.
