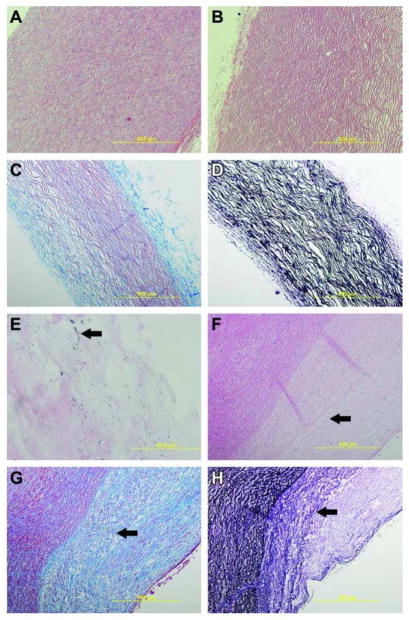
Figure 4.
Histology of native control tissue and pristine biomaterial. a) 100× H&E staining of native porcine aorta with cell nuclei present; b) 100× H&E staining of decellularized aorta showing removal of cellular components; c) 100× Masson’s trichrome staining of the biomaterial with a black arrow indicating collagen and the white arrow indicating lighter staining collagen; d) 100× van Geison’s stain of the biomaterial showing the presence of the black elastin fibers; e) 1000× H&E staining of the biomaterial showing the presence of the AuNPs; f) 100× H&E staining of native tissue and the biomaterial at 6 months. Arrow indicates the nuclei of cells that have moved into the patch area; g) 100× Masson’s trichrome staining of the biomaterial with a black arrow indicating the transition zone between the biomaterial and native tissue; h) 100× van Geison’s stain of the biomaterial showing the presence of the black elastin fibers. The black arrow indicates that the transition zone where the biomaterial patch is presenting characteristics more similar to the native tissue.

