Figure 1. Photoemission process in SrTiO3.

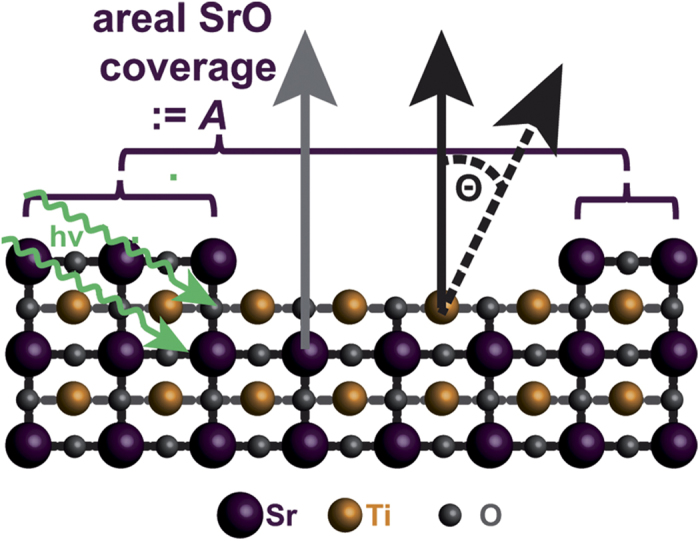
Schematic illustration of the photoemission process from SrTiO3 single crystals. Black and grey arrows represent electrons emitted at Ti and Sr ions, respectively.

Schematic illustration of the photoemission process from SrTiO3 single crystals. Black and grey arrows represent electrons emitted at Ti and Sr ions, respectively.