
Figure 2. Systematic surface termination variation in SrTiO3 single crystals.
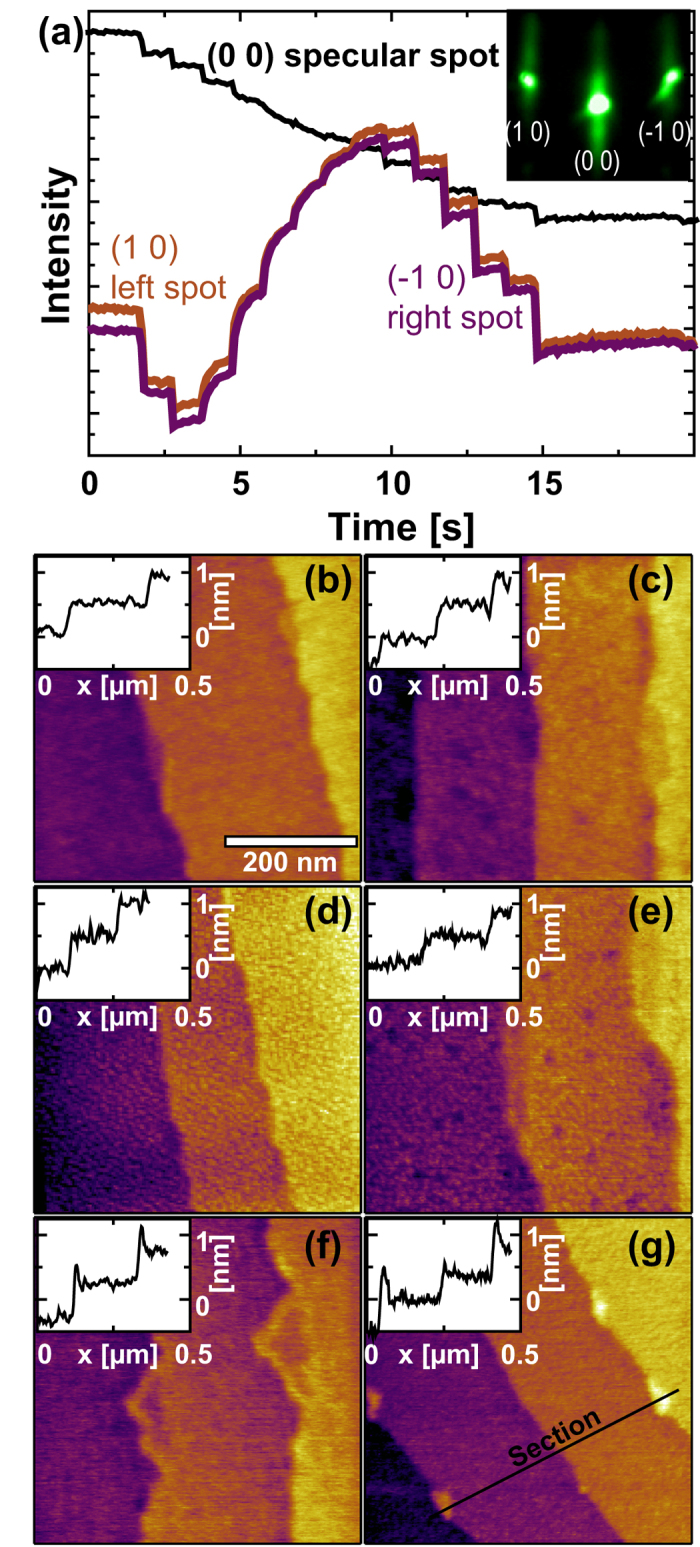
(a) Representative RHEED intensity during SrO deposition. Inset: Exemplary RHEED pattern after SrO growth (14 pulses). (b–g) AFM morphology after deposition of 2, 4, 6, 8, 10, and 12 pulses of SrO, respectively. Step terraces are of unit cell height (≈4 Å). Insets: Representative line profiles from the AFM scans along sections like the one depicted in (g).