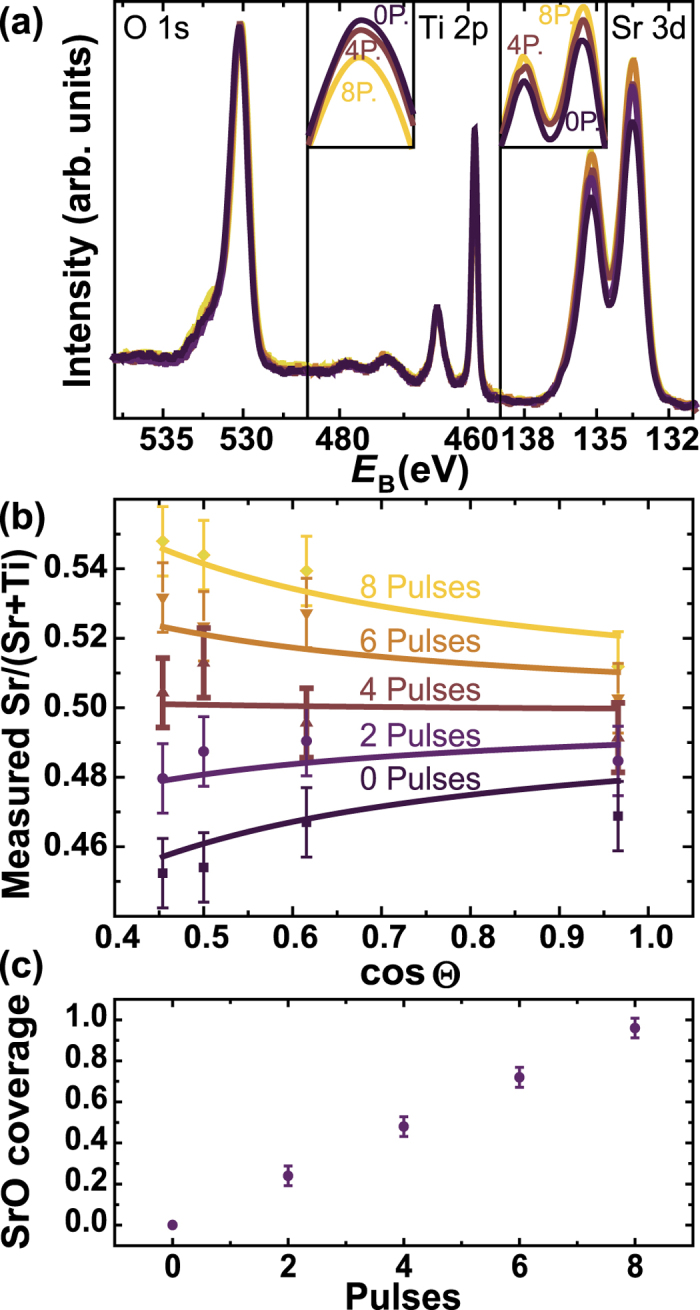
Figure 3. XPS analysis and termination determination of SrTiO3 single crystals.

(a) Representative XPS spectra for SrTiO3 crystals with increasing amounts of SrO coverage normalized to the O1s peak intensity. The Ti2p and Sr3d peaks have the same shape and binding energy for each sample, indicating the absence of a second phase. Insets: Zoom-in on the peaks for films with 0, 4 and 8 pulses of SrO. (b) Measured cation ratios (data points) as a function of the photoemission angle and fits (solid lines) according to equation (7). (c) SrO coverage extracted from the fits in (b).
