
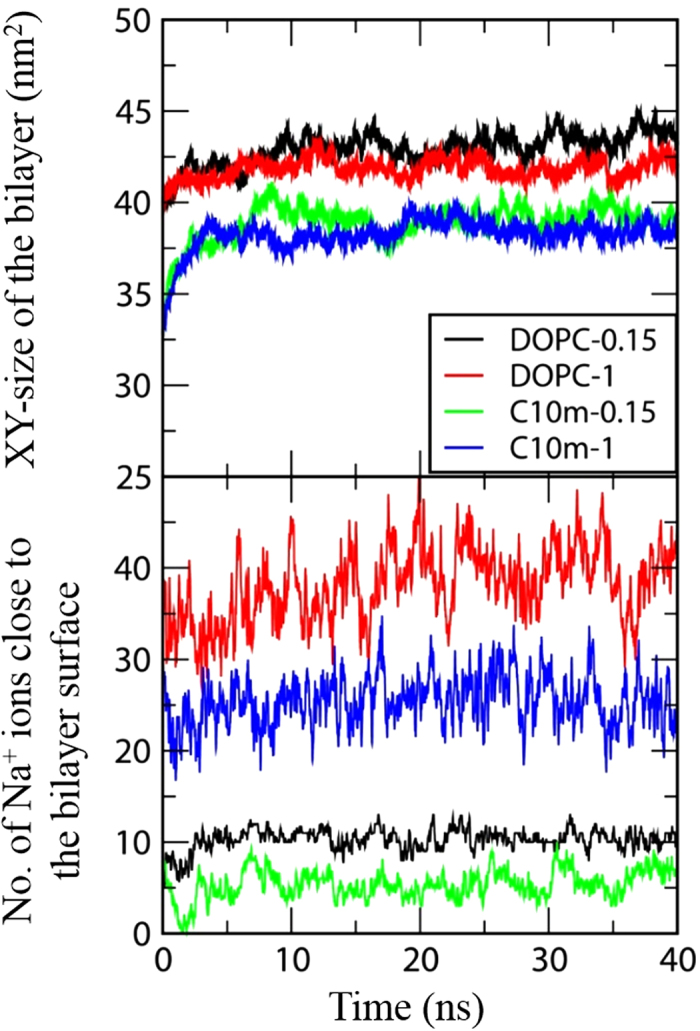
Figure 5. The bilayer size in XY dimension (top) and the number of Na+ ions close to the bilayer surface (bottom) as functions of time.
Official websites use .gov
A
.gov website belongs to an official
government organization in the United States.
Secure .gov websites use HTTPS
A lock (
) or https:// means you've safely
connected to the .gov website. Share sensitive
information only on official, secure websites.