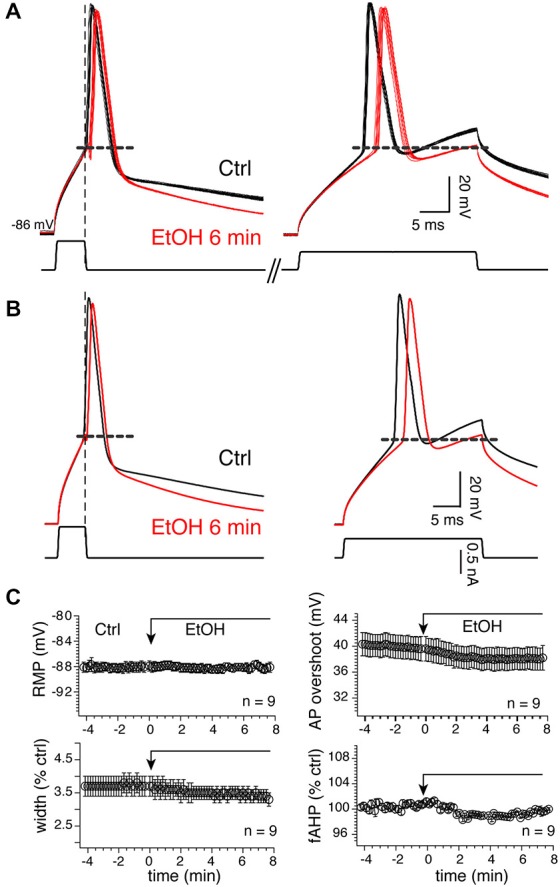
Figure 10.

Twenty millimolar EtOH alters AP properties. (A) Fifteen consecutive overlapping APs evoked with a short (left) or long (right) injected current pulses before (dark lines) and 6 min (red lines) after EtOH exposure in a representative MSN. Self- (left traces) and current-sustained APs (right traces) were evoked sequentially in the same sweeps. Vertical and horizontal broken lines indicate the end of the short pulse and spike threshold, respectively. (B) Average of traces shown in (A). (C) Mean ± SEM of resting membrane potential (RMP), AP width (width), amplitude (ampl) and fAHP before (Ctrl) and during EtOH exposure. Except for RMPs, all parameters were expressed as percent of control of values (100%) measured before EtOH perfusion. *p < 0.05 and **p < 0.001.
