Figure 4.

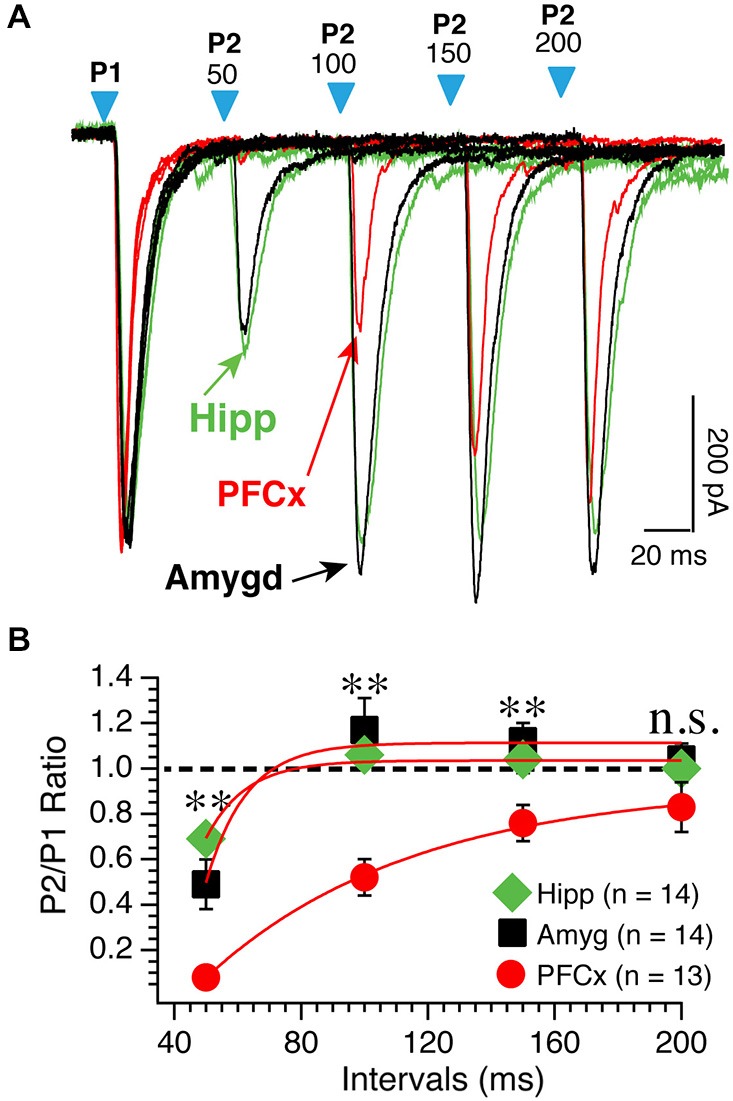
PPR varies as a function of synaptic inputs. (A) Representative overlapping individual traces of paired AMPA currents recorded at −70 mV at different intervals from 50−200 ms following stimulation of cortical (red traces), amygdala (black traces), and hippocampal (green traces) pathways. Blue arrowheads show the onset of paired light stimulations. Numbers above indicate the intervals between first and second stimulations. Hippocampal traces were scaled down to match amplitudes of similar cortical and amygdala first EPSCs. (B) Average P2/P1 AMPA current ratio at various intervals. *p < 0.05 and **p < 0.01.
