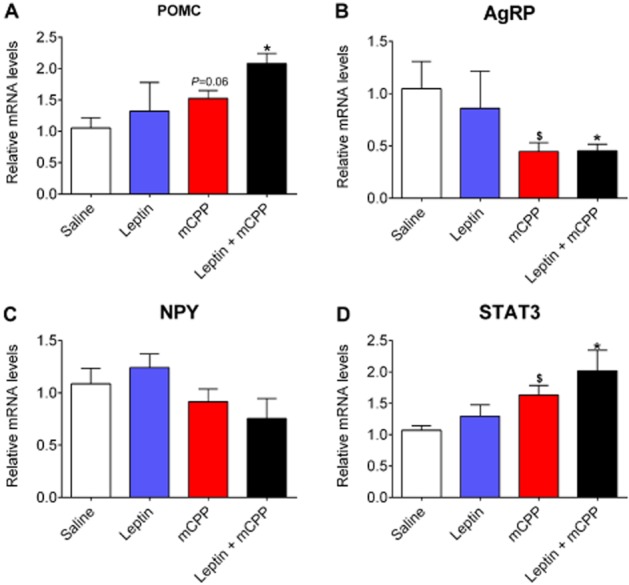
Figure 3.

Effects of mCPP and leptin on hypothalamic gene expression. Relative mRNA levels for POMC (A), AgRP (B), NPY (C) and STAT3 (D) in the hypothalamus 2 weeks after various treatments. Data are presented as mean ± SEM. n = 4 in each group. $P < 0.05 between saline versus mCPP; *P < 0.05 between leptin + mCPP versus saline; two-way anova followed by the post hoc Newman–Keuls Student's tests.
