
Figure 4.
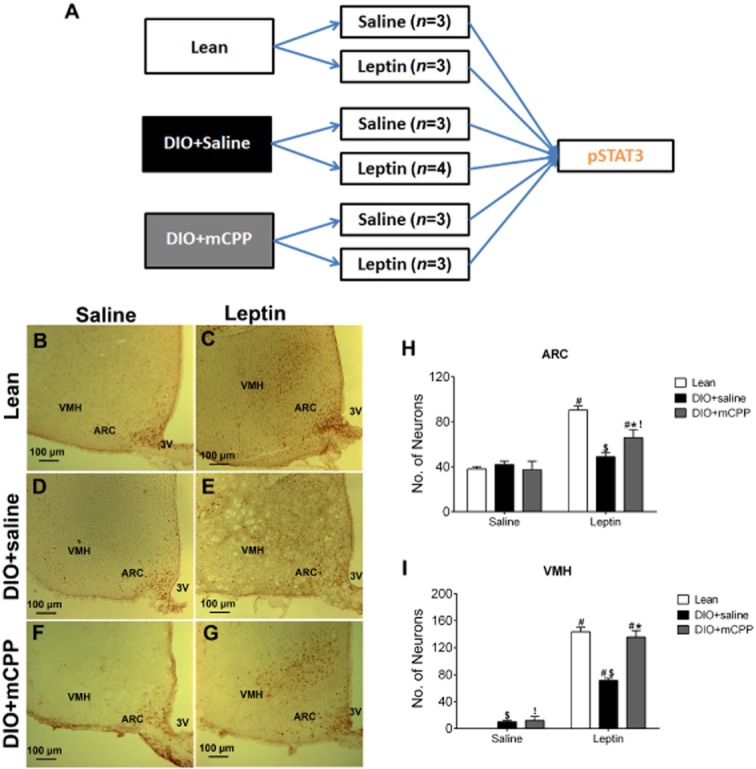
Effects of mCPP pretreatment on leptin-induced pSTAT3 in the ARC and VMH of DIO mice. (A) Diagram for the schedule used for experiments in Figures 4 and 5. (B–C) Representative pSTAT3 immunohistochemical staining in the ARC and VMH of chow-fed lean WT mice receiving a single bolus i.p. injection of saline (B) or 0.5 mg·kg−1 leptin (C). (D–E) Representative pSTAT3 immunohistochemical staining in the ARC and VMH of DIO + saline mice (8 weeks on a HFD and in the last 2 weeks given daily i.p. injections of saline), after receiving a single bolus i.p. injection of saline (D) or 0.5 mg·kg−1 leptin (E). (F–G) Representative pSTAT3 immunohistochemical staining in the ARC and VMH of DIO + mCPP mice (8 weeks on a HFD feeding and in the last 2 weeks given daily i.p. injections of 1.5 mg·kg−1·day−1 mCPP), after receiving a single bolus i.p. injection of saline (F) or 0.5 mg·kg−1 leptin (G). (H–I) Number of pSTAT3-positive neurons in the ARC (H) and VMH (I) of the various groups. Data are presented as mean ± SEM. n = 3–4 in each group. #P < 0.05 between saline and leptin within the same animal group; $P < 0.05 between Lean and DIO + saline within the same injection group; *P < 0.05 between DIO + saline and DIO + mCPP within the same injection group; !P < 0.05 between Lean and DIO + mCPP within the same injection group; two-way anova followed by the post hoc Newman–Keuls Student's tests.