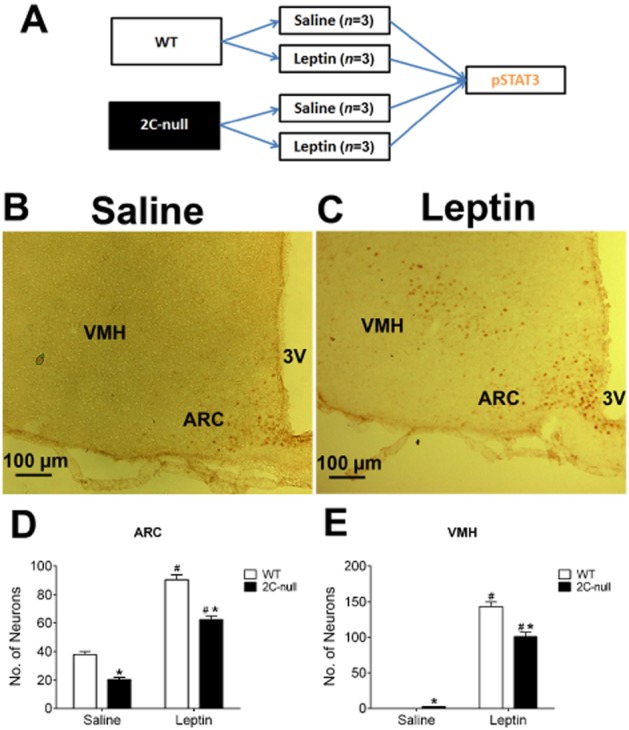
Figure 6.

Leptin-induced pSTAT3 in the ARC and VMH of 2C-null mice. (A) Diagram of the schedule used for the experiments in Figures 6 and 7. (B–C) Representative pSTAT3 immunohistochemical staining in the ARC and VMH of chow-fed 2C-null mice receiving a single bolus i.p. injection of saline (B) or 0.5 mg·kg−1 leptin (C). Note that representative images from WT mice have been included as the ‘lean’ group (from Figure 3). (D–E) Quantification of number of pSTAT3-positive neurons in the ARC (D) and VMH (E) of WT or 2C-null littermates. Data are presented as mean ± SEM. n = 3 in each group. #P < 0.05 between saline and leptin within the same genotype; *P < 0.05 between WT and 2C-null within the same injection groups; two-way anova followed by the post hoc Newman–Keuls Student's tests.
