
Figure 2.
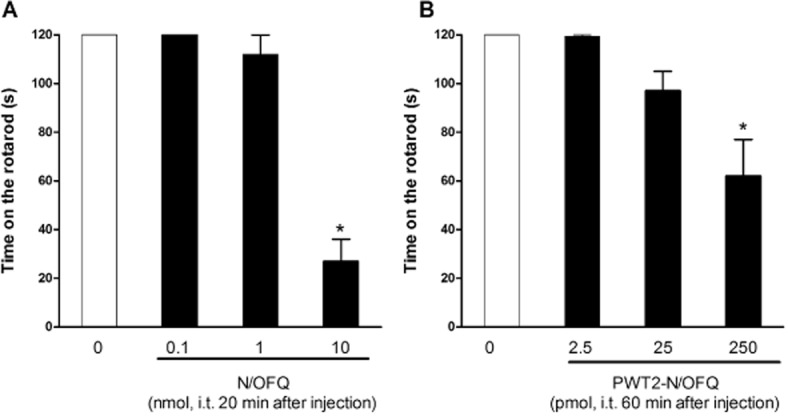
Dose–response curves to i.t. N/OFQ (0.1–10 nmol, panel A) and PWT2-N/OFQ (2.5–250 pmol, panel B) in the rotarod test performed in the same mice used in the tail withdrawal assay. Data are time on the rotarod (s) 20 min or 60 min following i.t. injection of N/OFQ or PWT2-N/OFQ respectively. Each data point represents mean ± SEM (n = 12). *P < 0.05, significantly different from vehicle.