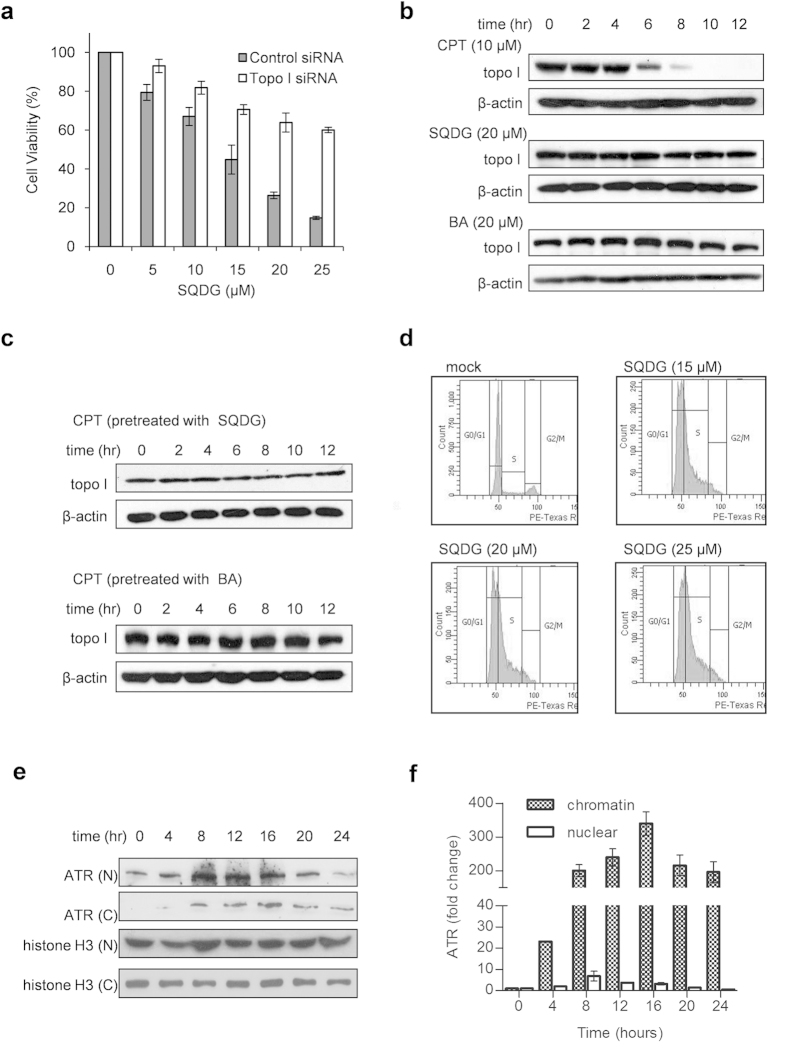
Figure 4. SQDG mediated MOLT-4 cell killing is topo I dependent.
SQDG treatment precludes camptothecin mediated formation of topo I-DNA complexes and generates DNA replication stress in MOLT-4 cells. (a) Knockdown of topo I in MOLT-4 cells. MOLT-4 cells were transfected with 100 nM topo I siRNA or 100 nM control siRNA (ctrl siRNA). After 48 hours of transfection cells were treated with indicated concentrations of SQDG for 72 hours and MTT assay was performed. Three independent experiments were performed and data are represented as mean % cell viability ± SD. Solid bars indicate cells transfected with control siRNA and hollow bars indicate cells transfected with topo I siRNA. (b) Topo I immunoband depletion assay in MOLT-4 cells. The cells were treated with 10 μM CPT or 20 μM SQDG or 20 μM BA and harvested at indicated time points. Western blotting was performed using anti-topo I or anti-β-actin antibodies. Complete scans of the different blots are presented in the Supplementary Figure S11. (c) Pretreatment immunoband depletion assay. MOLT-4 cells were first treated with either 20 μM SQDG or 20 μM BA for 2 hours and then treated with 10 μM CPT for indicated time points. Western blotting was performed using anti-topo I or anti-β-actin antibodies. Complete scans of the different blots are presented in the Supplementary Figure S12. (d) Cell cycle analysis of SQDG treated MOLT-4 cells. Cells were treated with different concentrations of SQDG (15 μM, 20 μM and 25 μM) for 24 hours. Cells were fixed in 70% ethanol and flow cytometry was performed. (e) ATR recruitment at chromatin in SQDG treated MOLT-4 cells. MOLT-4 cells were treated with 15 μM SQDG for indicated time points and nuclear and chromatin fractionations were performed. Levels of ATR in chromatin and nuclear fractions were detected by western blot analysis. Histone-H3 was used as loading control. ‘N’ stands for nuclear fraction and ‘C’ stands for chromatin fraction. Complete scans of the different blots are presented in the Supplementary Figure S13. (f) Histogram showing fold changes of ATR in chromatin and nuclear fractions after 15 μM SQDG treatment for indicated time points. Protein levels were quantitated by densitometry analysis of gel bands. ATR levels were normalized with respective histone H3 levels and fold change was calculated. Error bars show standard deviation of mean for the two independent experiments.

