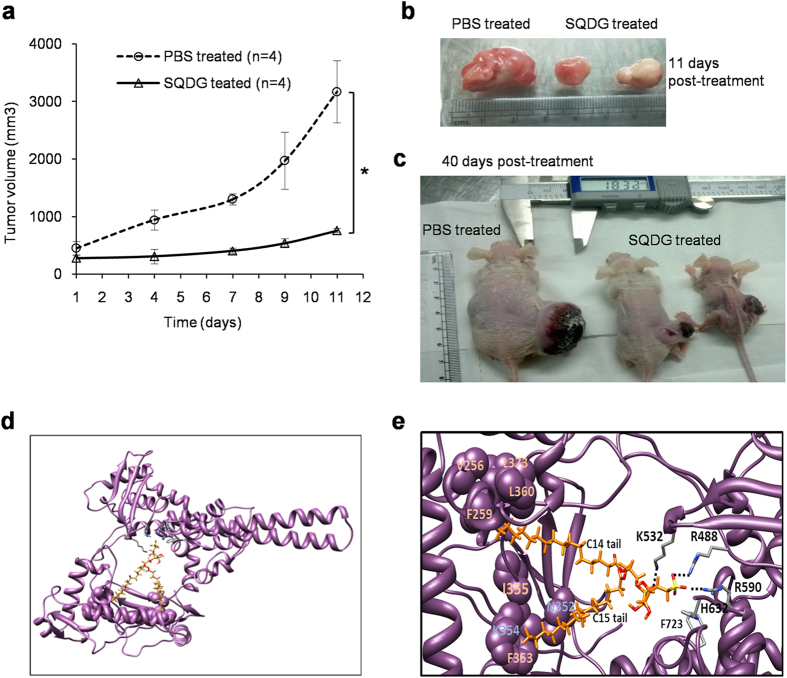
Figure 6. Effects of SQDG treatment on growth of MOLT-4 subcutaneous xenografts in nude mice and molecular docking of SQDG with topo I enzyme.
(a) Plot for tumor volume versus treatment time. SQDG (2 mg/kg/body weight) was injected intraperitoneally in the mice bearing MOLT-4 xenografts (n = 4). In control mice equal volumes of PBS were injected (n = 4). Treatments were given at day 1 and day 7 and tumor volumes were measured at day 1, day 4, day 7, day 9 and day 11. Each data point represents the average tumor volume. Data were analyzed by Student’s T-test and were found to be statistically significant (P < 0.05, SQDG vs. PBS treated). (b) Image of tumors from SQDG treated and vehicle treated mice at day 11 post start of the treatment. (c) Image of mice bearing tumors in SQDG treated and vehicle treated groups at day 40 post stop of the treatment. (d) SQDG (shown in orange) docks in the DNA binding region of topo I protein (PDB ID: 1A36) (shown in purple). (e) Predicted interactions between SQDG and topo I. Oxygen and sulfur atoms of SQDG are colored as red and yellow, respectively. Possible hydrogen bonds between the oxygen atoms and amino acid residues are shown as dotted lines. The amino acid residues in vicinity with hydrophobic carbon tails of SQDG are shown as spheres (purple).

