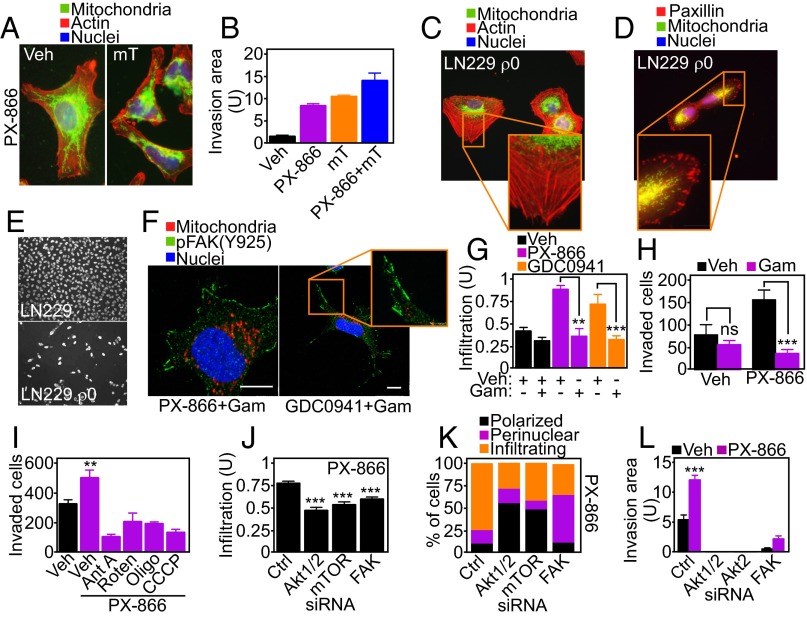
Fig. 4.
Control of tumor cell invasion by spatiotemporal mitochondrial bioenergetics. (A) PC3 cells were labeled with MitoTracker Red, phalloidin Alexa488, and DAPI, treated with PX-866, and analyzed for mitochondrial infiltration into the peripheral cytoskeleton in the presence of vehicle or the mitochondrial-targeted ROS scavenger mitoTEMPO (mT; 50 μM). (B) PC3 cells were incubated with the indicated agents alone or in combination (PX-866+mT) and analyzed for tumor cell invasion across Matrigel. Mean ± SEM. P (ANOVA) < 0.0001. (C and D) Mitochondrial (mt)DNA-depleted LN229 (ρ0) cells were stimulated with NIH 3T3 conditioned media for 2 h, labeled with MitoTracker Red, DAPI, and either phalloidin Alexa488 (C) or an antibody to FA-associated paxillin (D), and analyzed by fluorescence microscopy. Representative pseudocolored images are shown. Magnification, 60×. (E) WT or ρ0 LN229 cells were analyzed for invasion across Matrigel-coated Transwell inserts. Representative images of invasive cells stained with DAPI are shown. Magnification, 20×. (F) PC3 cells treated with vehicle or PI3K inhibitors in combination with the mitochondrial-targeted small-molecule Hsp90 inhibitor Gamitrinib (Gam) were labeled with anti–pY925-FAK Alexa488 followed by fluorescence microscopy. Representative 1-µm extended-focus confocal images are shown. Magnification, 63×. (Scale bar, 10 μm.) (G) PC3 cells treated with vehicle or PI3K inhibitors with or without Gamitrinib (1 μM) were labeled with MitoTracker Red, phalloidin Alexa488, and DAPI and quantified after 48 h for mitochondrial infiltration into lamellipodia by fluorescence microscopy; n = 48. Mean ± SEM. **P = 0.0044; ***P < 0.0009. (H) PC3 cells were treated with vehicle or PX-866 (5 μM) with or without Gamitrinib and quantified for invasion across Matrigel. Mean ± SEM of replicates (n = 2). ***P < 0.0001. ns, not significant. (I) PC3 cells were incubated with vehicle or PX-866 alone or in combination with the various mitochondrial respiratory chain inhibitors and analyzed for Matrigel invasion. Ant A, Antimycin A; Oligo, Oligomycin; Roten, Rotenone. Mean ± SEM. **P = 0.006. (J) PC3 cells transfected with control siRNA or siRNA to Akt1/2, mTOR, or FAK were labeled as in C, treated with PX-866, and quantified for mitochondrial infiltration into lamellipodia; n = 44. Mean ± SEM. ***P < 0.0001. (K) siRNA-transfected PC3 cells labeled as in C were treated with PX-866 (5 μM) and analyzed for mitochondrial morphology (polarized, perinuclear, infiltrating) by fluorescence microscopy; n = 21. (L) PC3 cells transfected with the indicated siRNAs were quantified for invasion across Matrigel in the presence of vehicle or PX-866. Mean ± SEM (n = 4). ***P < 0.0001.

