Fig. S2.
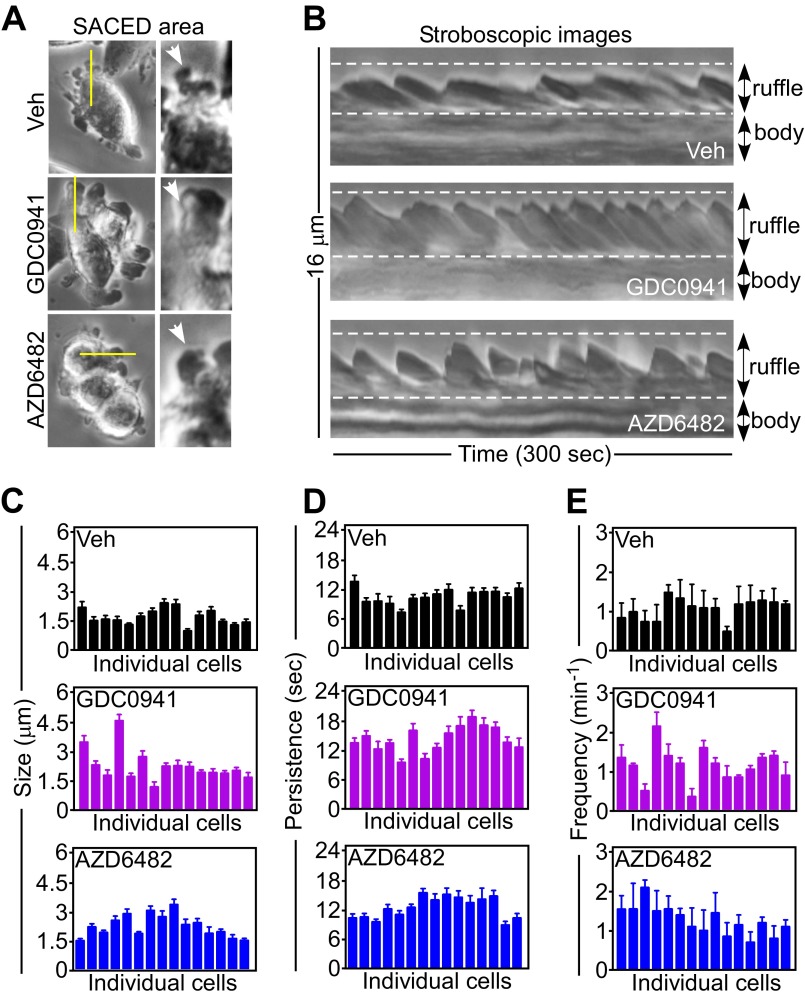
PI3K therapy stimulates membrane ruffle dynamics. (A) PC3 cells treated with vehicle or the indicated PI3K inhibitors for 48 h were analyzed by time-lapse video microscopy. Four discrete regions per cell were followed over time to derive stroboscopic images by SACED. (Left) Still images at the beginning of the sequence. Yellow lines indicate the discrete areas analyzed for a cell. (Right) Zoomed-in micrographs of the ruffles being analyzed (arrows). (B) PC3 cells were treated with vehicle or the indicated PI3K inhibitors and analyzed by stroboscopic microscopy. Images representing the dynamics of the cell border over 300 s are shown. The positions of membrane ruffles and cell bodies are indicated. (C–E) PC3 cells (n = 15) as in B were analyzed for membrane ruffle dynamics by SACED with quantification of average ruffle size (C), time of ruffle persistence (D), and ruffle frequency (E). Each bar corresponds to an individual cell. Mean ± SEM (n = 4).

