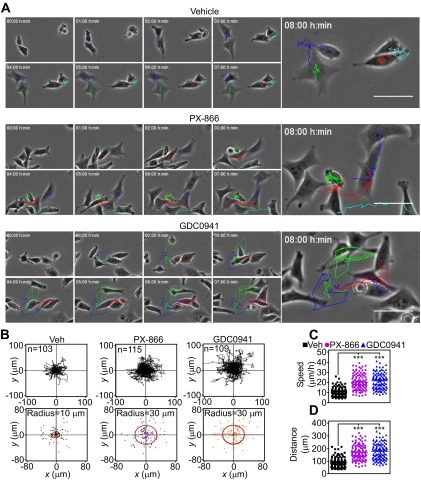
Fig. S3.
Adaptation-induced random tumor cell migration. (A) PC3 cells were treated with vehicle or the indicated PI3K inhibitors for 48 h, seeded onto 2D chemotaxis chambers, and analyzed by time-lapse video microscopy. The sequences were started immediately after setting up a gradient of NIH 3T3 conditioned media used as a chemoattractant. Videos were analyzed with WimTaxis software (Wimasis) and tracking data were exported into the Chemotaxis and Migration tool (Ibidi) for representation. Still images from the time lapse with trajectories overlaid at the indicated time intervals are shown. (Scale bars, 50 μm.) (B) PC3 cells treated with vehicle or PI3K inhibitors were analyzed for 2D chemotaxis. The trajectory (Top) and end points (Bottom) represented for all analyzed cells are shown; n ≥ 103. A circular region that splits the Euclidean distances 50:50 is indicated (radius). (C and D) PC3 cells were treated as in B, and speed of migration (C) or distance of migration (D) were quantitated by 2D chemotaxis analysis. ***P < 0.0001.

