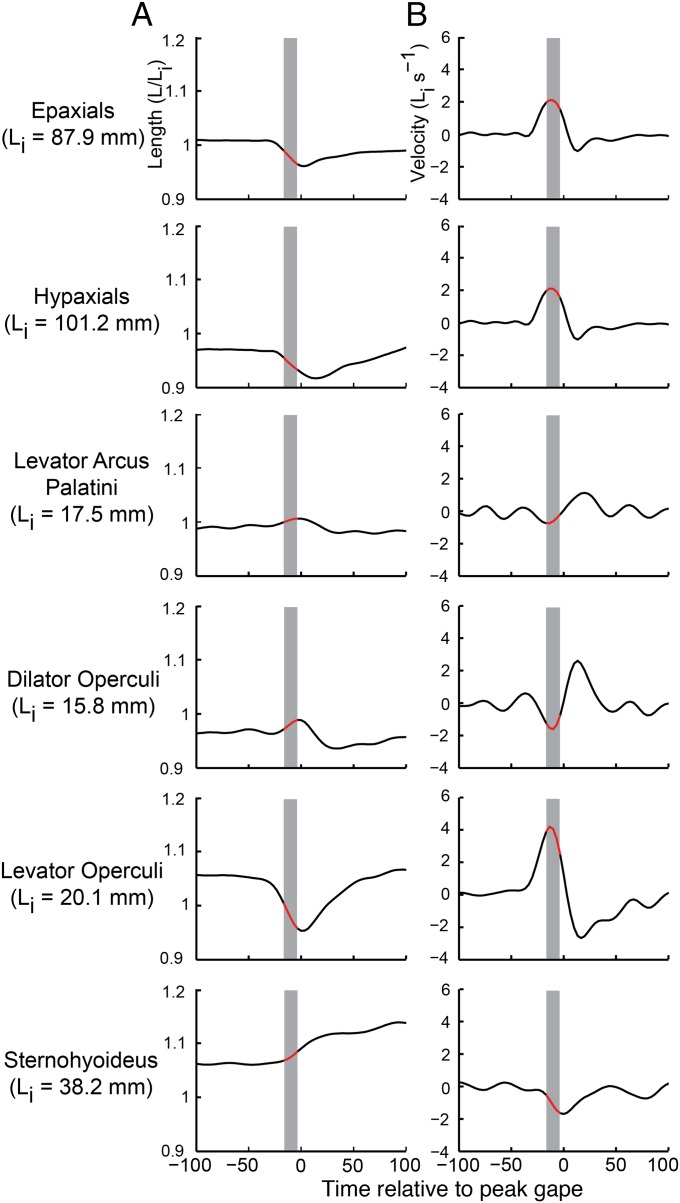
Fig. 4.
Muscle length and velocity from a sample strike. Muscle length (A) is shown normalized to the mean initial muscle length (Li), which is listed for each muscle of this individual. Decreasing length values indicate muscle shortening. Muscle velocity (B), initial muscle lengths (Li) per second, with positive values indicating muscle shortening. The gray bars mark the time and red regions mark the length and velocity values during which expansion power magnitude was within 25% of its maximum.

