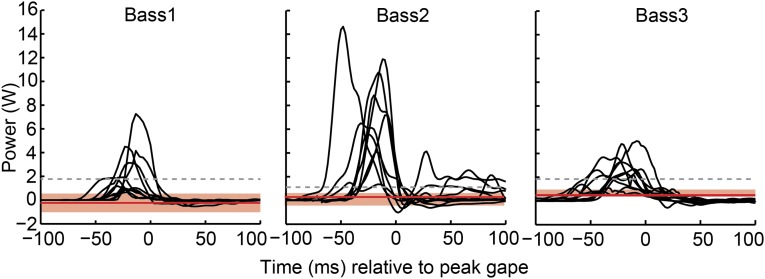
Fig. 6.
Comparison of suction expansion power and cranial muscle power capacity. Mouth expansion power of all strikes (black lines) are graphed as a function of time for each individual. The gray dashed line indicates the maximum power capacity (Popt) of all of the cranial muscles summed together, for each individual. The red line shows the median of the velocity-corrected power capacity (Pvc) of all of the cranial muscles summed together, with the red shaded region extending from the 25th to 75th percentiles.

