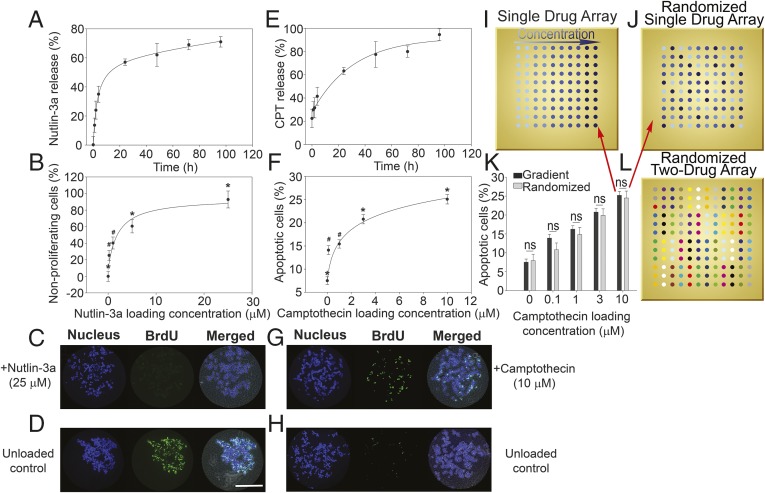
Fig. 2.
Cumulative drug release and HCT116 cell responses to drug-loaded microarrays. (A) Nutlin-3a release profile from microarray revealed a burst release of ∼8 h, followed by a steady release rate over 5 d. Release profiles show mean ± SD of three replicates, and data are fitted using an exponential decay model. (B) Percent of nonproliferative HCT116 cells on nutlin-3a–loaded microarray increases with increasing drug loading concentration. Proliferation was quantified via BrdU incorporation, and data are normalized to an unloaded control. Significant differences were determined by ANOVA [F(4,138) = 19.068; P < 0.05], followed by Tukey’s post hoc analysis. (C) Representative fluorescence micrographs of nonproliferating cells on a 25 μΜ nutlin-3a–loaded polymer island (evidenced by low BrdU staining). (D) Representative fluorescence micrographs of an unloaded control island with highly proliferative cells (demonstrating high BrdU staining). (E) Camptothecin release profile from microarray revealing a burst release of ∼24 h, followed by a steady release rate over 5 d. Release profiles show mean ± SD of three replicates, and data are modeled using exponential decay. (F) Percent of apoptotic cells on camptothecin-loaded microarray increases with increasing drug loading concentrations. Apoptosis was quantified by annexin V staining, and significant differences were determined by ANOVA [F(4,479) = 52.778; P < 0.05], followed by Tukey’s post hoc analysis. (G) Representative fluorescence micrographs displaying high levels of cells undergoing apoptosis on a 10 μΜ camptothecin-loaded polymer island (demonstrating high annexin V staining). (H) Representative fluorescence micrographs of an unloaded control island with low levels of apoptotic cells (showing low annexin V staining). (I) Schematic of a single factor dosing array layout with increasing drug loading concentrations. (J) Schematic of a randomized single factor array with loading concentrations configured in randomized fashion. (K) Statistical comparison of cell apoptosis between randomized and nonrandomized single drug array configurations demonstrating the results are independent of array configuration (n = 3). This indicates that there is negligible cellular cross-talk and drug interaction between neighboring islands. (L) Schematic of a randomized two-factor dosing array used in combinatorial microarrays. Patterns represent the 16 different combinations of two drugs (four concentrations per drug). *P < 0.05 compared with all other conditions; #P < 0.05 compared with control. (Scale bar: 200 μM.)

