Fig. 3.
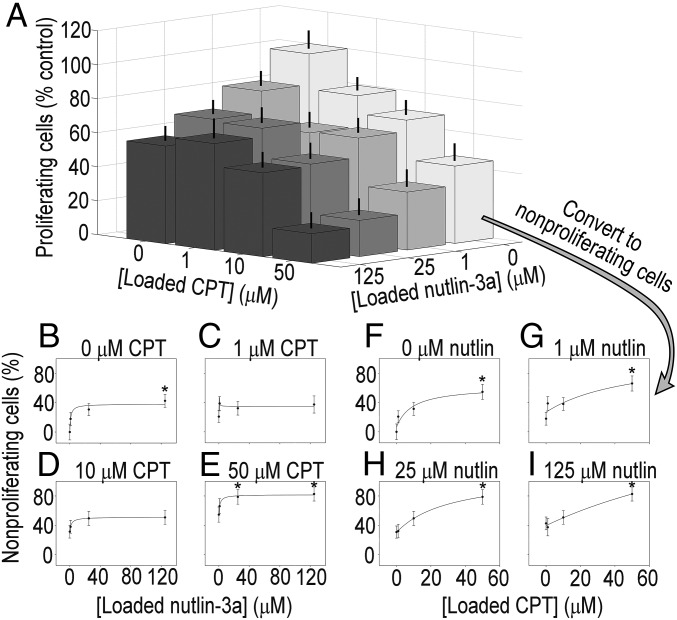
Patient-derived CA1 colorectal cancer stem-like cell proliferation and dose–response curves from combinatorially loaded drug-eluting microarrays. (A) Proliferation of CA1 cells on drug-eluting cellular microarrays. Loading concentrations of nutlin-3a [F(3,233) = 5.762; P < 0.05] and camptothecin [F(3,233) = 16.884; P < 0.05] affected antiproliferative activity, as determined by ANOVA. Subadditive effects were observed from combination treatments, as evidenced by the greater decrease in proliferation from higher concentration combinations compared with the highest concentrations of either nutlin-3a or camptothecin alone. Error bars represent SEM. (B–E) Dose–response curves for fixed camptothecin concentrations of 0, 1, 10, and 50 μM over a range of nutin-3a concentrations. There was no significant change in Emax values of the nutlin-3a response with the added presence of camptothecin; however, there was a significant increase (by 75%) in the sensitivity to nutlin-3a when combined with 10 μΜ camptothecin compared with nutlin-3a alone (28.6 vs. 50.0; SI Appendix, Fig. S15), indicative of an increase in antiproliferative activity. (F–I) Dose–response curves for fixed nutlin-3a concentrations of 0, 1, 25, and 125 μM, with a range of camptothecin concentrations. Although Emax values generally increased with added nutlin-3a, the values were not significantly different. Similarly, differences in sensitivity to camptothecin owing to the addition of nutlin-3a were not observed. Proliferation data were transformed to nonproliferation data by subtracting the former from 100%. *P < 0.05 compared with 0 μM drug.

