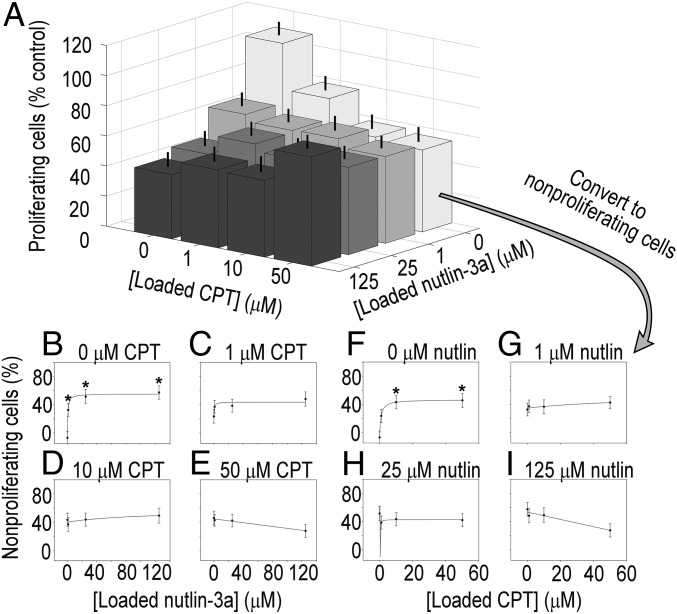
Fig. 4.
Patient-derived CA2 CCSC proliferation and dose–response curves from combinatorially loaded drug-eluting microarrays. (A) Proliferation of CA2 cells on drug-eluting cellular microarrays. Antiproliferative activity was increased from exposure to camptothecin [F(3,81) = 5.987; P < 0.05] and nutlin-3a [F(3,82) = 7.525; P < 0.05] as revealed by ANOVA, with a significant interaction effect between drugs [F(9,329) = 2.382; P < 0.05]. Combination treatments did not improve antiproliferative activity. In fact, an antagonistic effect was observed from combination treatments, in which increasing the concentrations of both drugs reversed drug-induced nonproliferation compared with high doses of individual drugs. Error bars represent SEM. (B–E) Dose–response curves for fixed camptothecin concentrations of 0, 1, 10, and 50 μM over a range of nutin-3a concentrations. There was a 90% decrease in the Emax values of the response to nutlin-3a in the presence of 10 μM camptothecin compared with 0 μM camptothecin (5.7 vs. 59.0; SI Appendix, Fig. S17), and a decrease of 114% in the Emax values with the addition of 50 μM (−8.3 vs. 59.0; SI Appendix, Fig. S17), indicating a decrease in antiproliferative activity. (E) The negative slope of the response curve for 50 μM camptothecin is indicative of an antagonistic drug interaction. (F–I) Dose–response curves for fixed nutlin-3a concentrations of 0, 1, 25, and 125 μM with a range of camptothecin concentrations. The response curves to ranges of camptothecin in the presence of fixed amounts of nutlin-3a reveal decreased Emax values, but the values were not significantly different (SI Appendix, Fig. S17). (H) Notably, the sensitivity of CA2 CCSCs to camptothecin decreased by 100-fold with the addition of just 1 μM nutlin-3a (133 for 0 µM nutlin compared with 1.6 for 1 µM nutlin; SI Appendix, Fig. S17). (I) The negative slope of the response curve for 50 μM camptothecin is indicative of an antagonistic drug interaction. Proliferation data were transformed to nonproliferation data by subtracting the former from 100%. *P < 0.05 compared with 0 μM drug.

