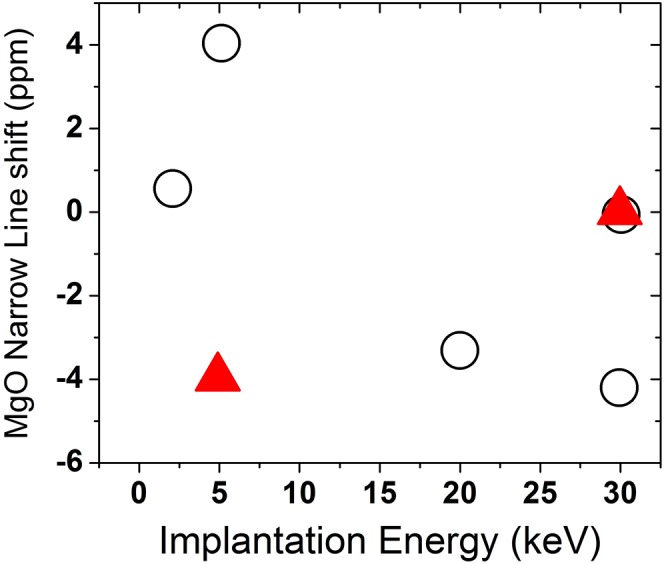
Fig. S5.

Shift of the narrow MgO resonance as a function of 8Li+ implantation energy at 300 K and 3 T (open circles). The zero of shift is arbitrarily chosen to be zero for one of the 30-keV spectra at each field. Statistical error bars from the fits are included, but systematic uncertainty dominates and is indicated by the difference between the two 300 K values. Red triangles: at 4.1 T and 250 K in a separate experiment.
