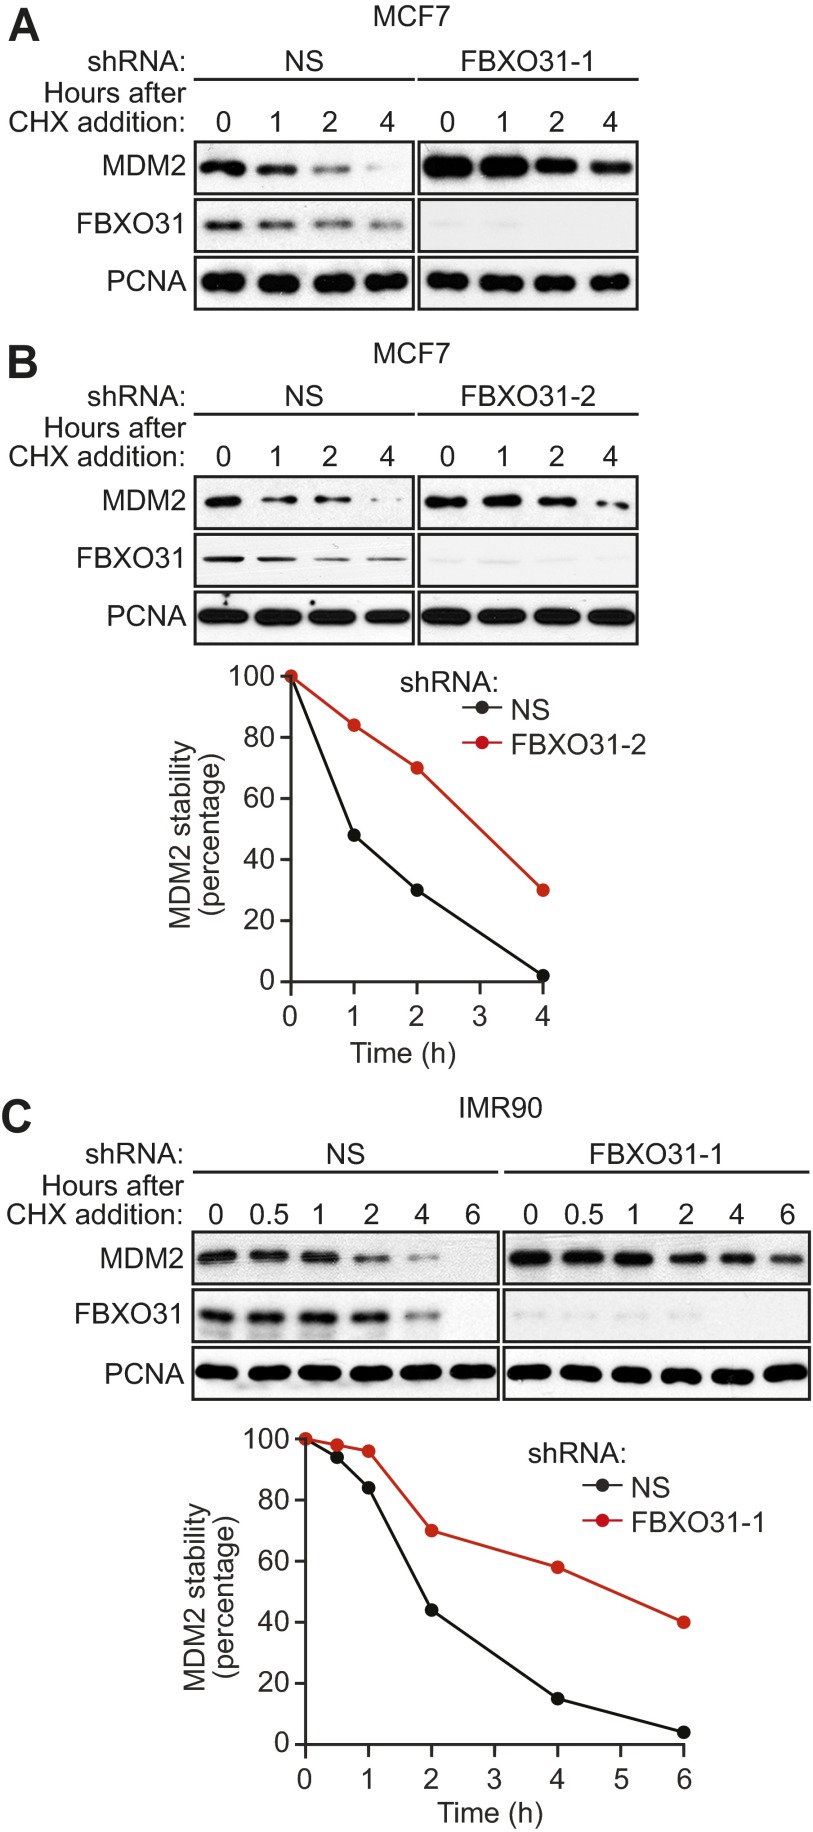
Fig. S2.
The half-life of MDM2 is increased following FBXO31 knockdown. (A) Cycloheximide-chase/immunoblot assay monitoring MDM2 stability in MCF7 cells expressing NS or FBXO31 shRNA at the indicated time points following treatment with cycloheximide (CHX). PCNA was monitored as a control. (B, Upper) Cycloheximide-chase/immunoblot assay monitoring MDM2 stability in cycloheximide-treated MCF7 cells expressing NS or FBXO31 shRNA (unrelated to that used in A and Fig. 2A). (Lower) Quantification of MDM2 levels. The graph shows the ratio of the relative levels of MDM2 and PCNA (control) at each time point; time 0 was set to 100%. (C, Upper) Cycloheximide-chase/immunoblot assay monitoring MDM2 stability in cycloheximide-treated IMR90 cells expressing NS or FBXO31 shRNA. (Lower) Quantification.

