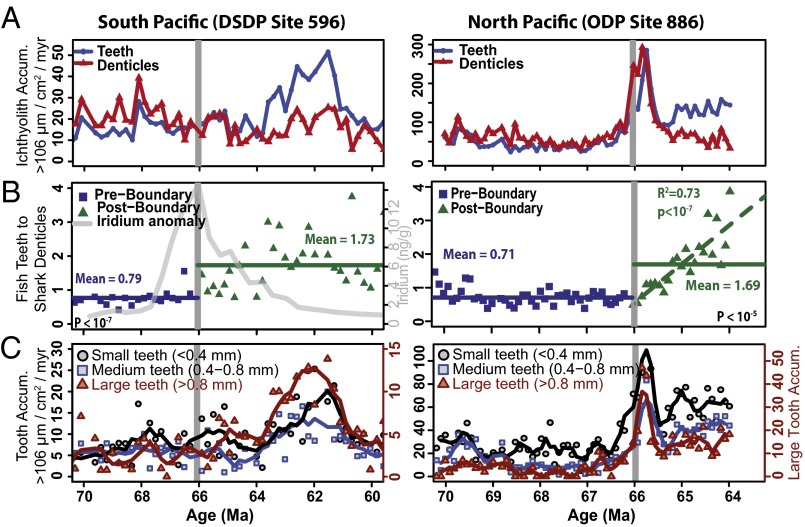
Fig. 1.
South Pacific [Left; DSDP Site 596 (38)] and North Pacific [Right; ODP Site 886 (25)] across the Cretaceous−Paleogene boundary (horizontal gray line). (A) Ichthyolith accumulation. Blue circles are teeth, interpreted as ray-finned fish, and red triangles are denticles, interpreted as sharks and rays. Units are in ichthyoliths per square centimeter per million years. (B) Ratio of fish teeth to shark denticles. Solid lines are mean values for Cretaceous (blue) and Paleocene (green). The dotted green line (Right) is a regression fit to the Paleocene dataset. Iridium anomaly data are from ref. 23. (C) Accumulation rates of three size classes of fish teeth. Small teeth (black circles) have maximum length of <0.4 mm, medium teeth (blue squares) are 0.4–0.8 mm, and large teeth (red triangles) are >0.8 mm. Large tooth accumulation is on the secondary axis and is scaled to twice that of the small and medium teeth to show pattern. Solid lines are three-point running means.

