Fig. 3.
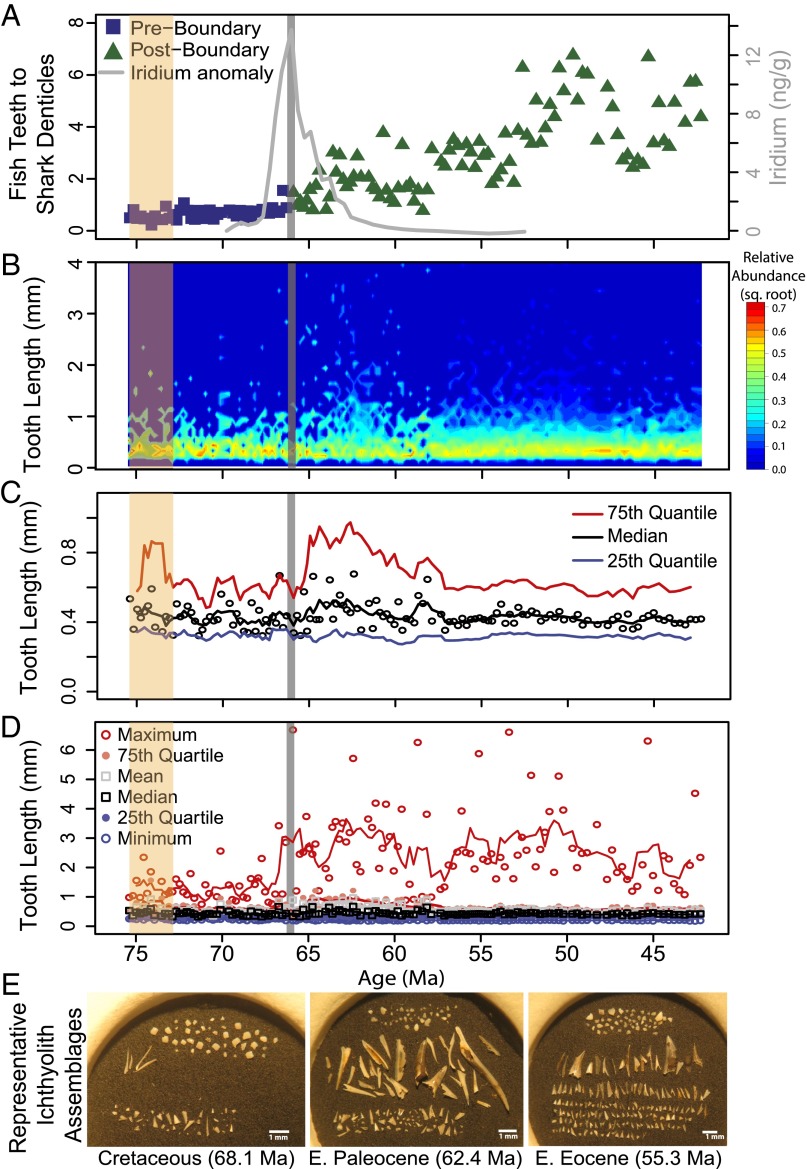
An extended record from the South Pacific Ocean (DSDP Site 596) of various ichthyolith community metrics; K/Pg boundary is vertical gray line. (A) Ratio of fish teeth to shark denticles. (B) Square root of relative abundance of ichthyolith size classes. Reds and yellows denote higher relative abundance at that tooth length, while blues denote relatively rare. (C) Black circles are individual assemblage tooth length medians, and solid lines are five-point running averages, with median (black), 25th quartile (blue), and 75th quartile (red). (D) Full size structure of tooth assemblages; solid lines are five-point running means. Maximum tooth size shown as open red circles. (E) Representative photos of ichthyolith assemblages > 106 μm from the Cretaceous, Paleocene, and Eocene from DSDP Site 596. Denticles (shark scales) are at the top of each assemblage, large teeth are in the middle, and smaller teeth are at the bottom of each photograph. Note the high abundance of “large” teeth in the Paleocene. Tan shading represents region of low tooth abundance. (Scale bar, 1 mm.)

