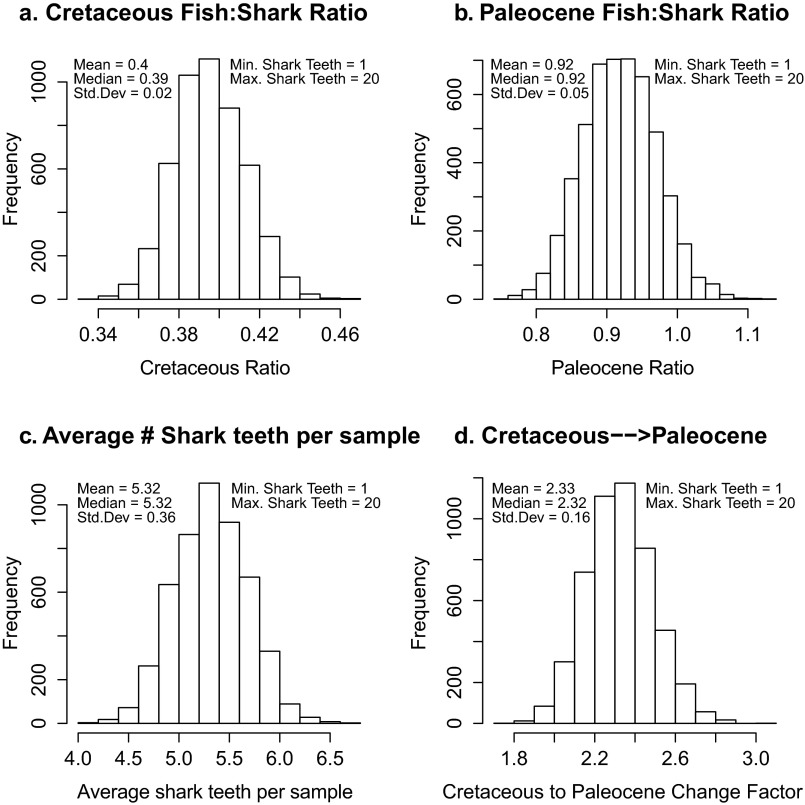
Fig. S3.
Results of bootstrapped shark tooth simulation 6, showing the spread of ratios calculated for each of 5,000 simulations. (A) Cretaceous ratios in each simulation. (B) Paleocene ratios in each simulation. (C) Average number of shark teeth present in each assemblage for each simulation. (D) Factor of change between the Cretaceous ratio and the Paleocene ratio calculated in each simulation. Note that there is no value < 1, so the ratio observed in the Paleocene is always greater than the ratio observed in the Cretaceous.

