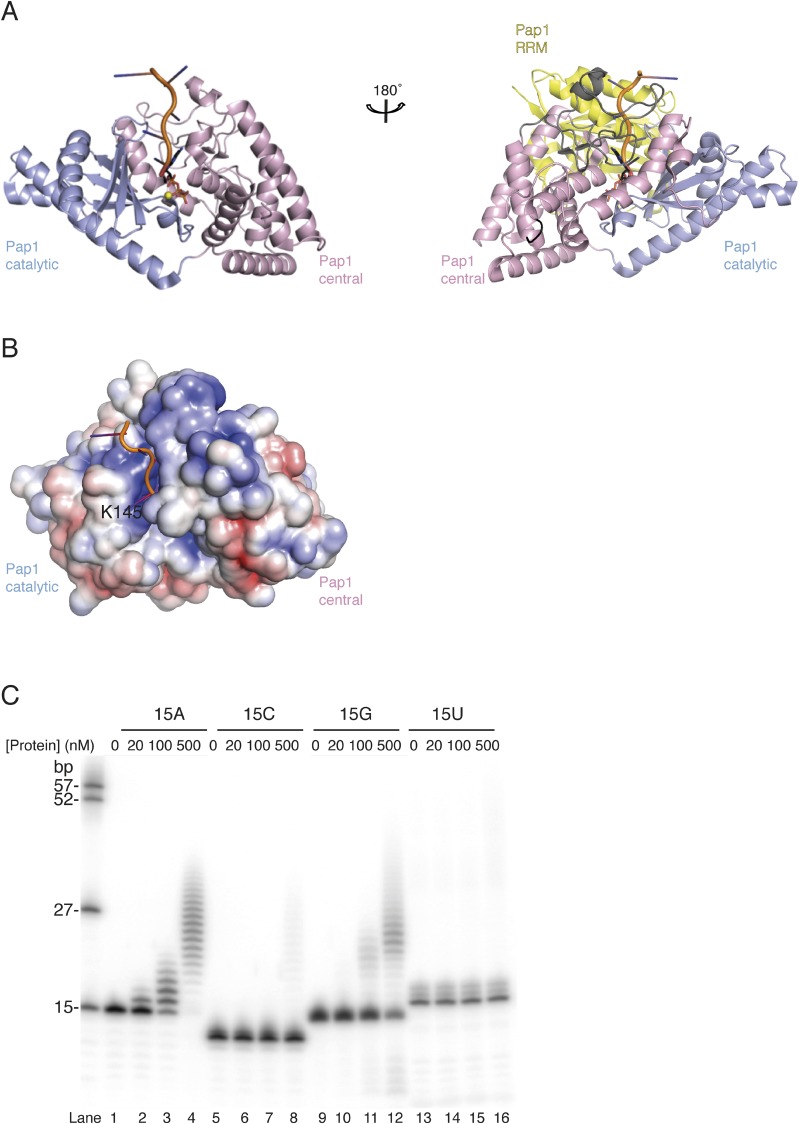
Fig. S2.
Closed conformations of nucleotidyl transferases. (A) Cartoon representation of substrate bound Pap1 in closed conformation (27). The molecules are shown in the same orientation as the view in Fig. 2A (Left) and 2B (Right). The loop regions between helices α6-α7 and α7-α8 are colored in black and gray, according to Fig. 2B (Right). Colors according to Fig. 2, with the RRM domain in yellow. RNA and ATP molecules are shown as cartoon and stick representations, respectively. The magnesium ion is shown as yellow sphere. RRM domain was removed for clarity in the left molecule. (B) Surface representation of Pap1 (without RRM domain), colored according to electrostatic surface potential over the range from −5 kT/e (red) to +5 kT/e (blue). The molecule is shown in the same view as in Fig. 4A. The conserved residue K145 near the active site (R655 in GLD-2) is annotated. (C) Polyadenylation assay with different protein concentrations (0, 20, 100, 500 nM) in the presence of 5′-32P-labeled 15mer poly(A), (C), (G), and (U) homopolymeric RNA substrates (100 nM).

