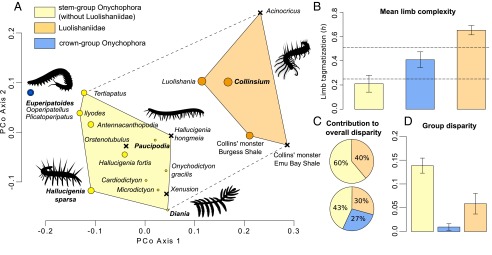
Fig. 5.

Morphospace and disparity analyses of total-group Onychophora. (A) Visualization of the morphospace using a principal coordinate analysis. Circle size is proportional to the degree of limb complexity (Dataset S1 and Fig. 4B). X denotes unavailable or incomplete limb data for the taxon; dashed line indicates morphospace distribution for all members of stem group Onychophora. (B) Comparison of mean degree of limb complexity in stem and crown group Onychophora. Horizontal dashed lines outline the complete range of limb complexity observed in extant Onychophora (SI Appendix, Note S3, and Dataset S1). (C) Partial disparity analyses indicating the contribution to overall disparity of Luolishaniidae within stem group Onychophora (Upper) and within total-group Onychophora (Lower). (D) Comparison of group disparity in stem and crown group Onychophora.
