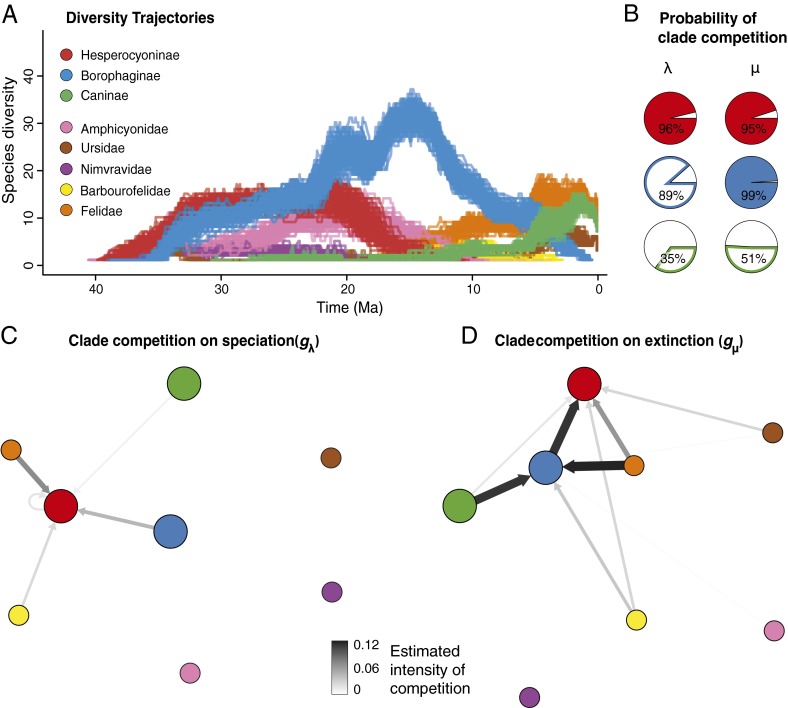
Fig. 4.
Diversity trajectories and the effect of clade competition on the speciation and extinction rates of each canid subfamily. (A) The diversity trajectories of the three canid subfamilies and the additional potential competitor carnivore clades (only North American species included). Reconstructions of diversity trajectories are replicated 100 times to incorporate uncertainties around the age of the fossil occurrences. (B) Posterior probabilities that multiple clade competition affects speciation and extinction rates. Changes in speciation and extinction rates of Hesperocyoninae and changes in extinction rates of Borophaginae are significantly correlated (posterior probabilities greater than 0.95) with changes in the diversity of multiple competitor clades. (C) Network showing the competitive effect imposed by each individual clade on the other clades’ speciation rate. (D) Network showing the competitive effect imposed by each individual clade on the other clades’ extinction rate. (C and D) Each arrow indicates the intensity of competition (gλ, gμ) imposed by a given clade toward one of the canid subfamilies. This metric quantifies the proportion of rate change (decrease for speciation and increase for extinction) associated with the addition of one species of the competing clade. Only arrows associated with significant correlations (based on B) are shown. (B–D) Color code identification presented on A also applies to the other panels.

