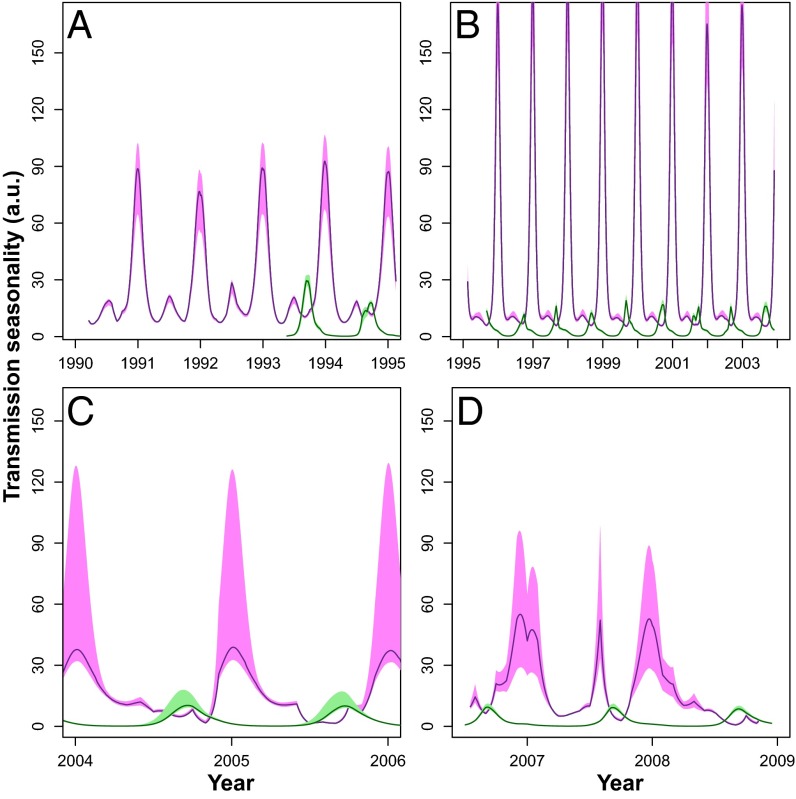
Fig. 3.
Fitted transmission seasonality with the SpTR model for each of the drug periods for Dielmo (violet) and Ndiop (green). Lines correspond to the mean of 500 fits, and shaded regions correspond to the 10th and 90th percentiles of all fits. Transmission was modeled as a seasonal spline basis and climatic covariates are explained in SI Text. Between years variability in transmission reflects the variability in rainfall and temperature anomalies. (A) Quinine period. (B) Chloroquine period. (C) Fansidar period. (D) Artemisinin combination therapies (ACT) period.

