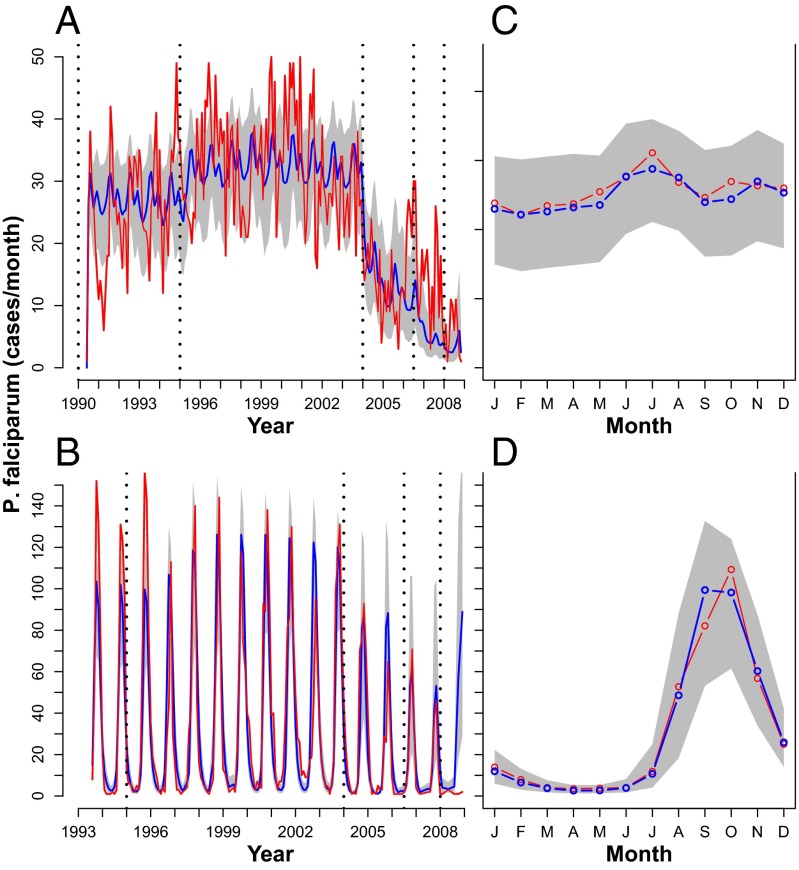
Fig. 4.
(A and C) Dielmo. (B and D) Ndiop. (A and B) Red, P. falciparum cases; blue, the mean of 1,000 simulations; gray shading, the 10th and 90th percentiles of the simulations. Simulations were done with parameters extracted from 500 fits, weighting them according to their likelihood. All of the simulations were done from the also fitted initial conditions, simulating all of the time series ahead (i.e., with no readjustment of any parameter at any point in time during the simulation). Model used: SpTR. (A) Dielmo; (B) Ndiop. (C and D) Monthly average of the curves in A and B. Simulations are shown in blue/gray and data in red. (C) Dielmo; (D) Ndiop.

