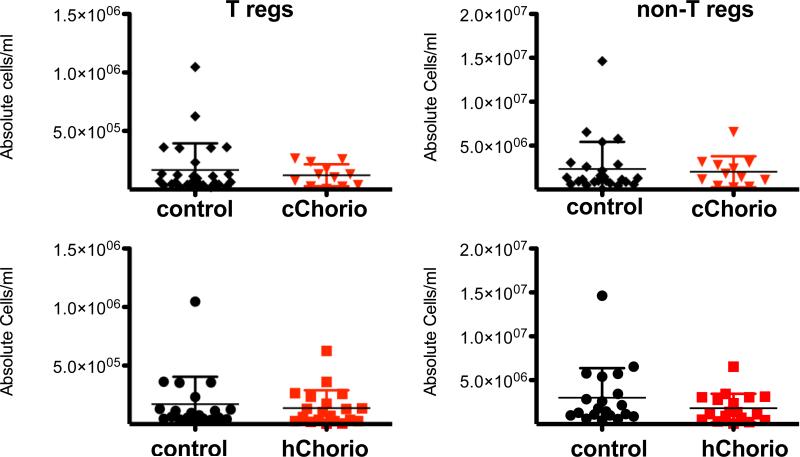
Figure 2. Absolute CD4+ T cell numbers in histological & clinical Chorio are similar to controls.
The absolute number of CD4+ T regulatory cells and non-regulatory cells per milliliter of cord blood was calculated for each patient and graphed. Patients were grouped into cChorio (top; inverted red triangles) or hChorio (bottom; red squares) and controls. Means ± SD are shown. P= 0.58 and 0.36 for Tregs in hChorio and cChorio versus controls, respectively. P= 0.12 and 0.48 for non-Tregs in hChorio and cChorio versus controls, respectively.

