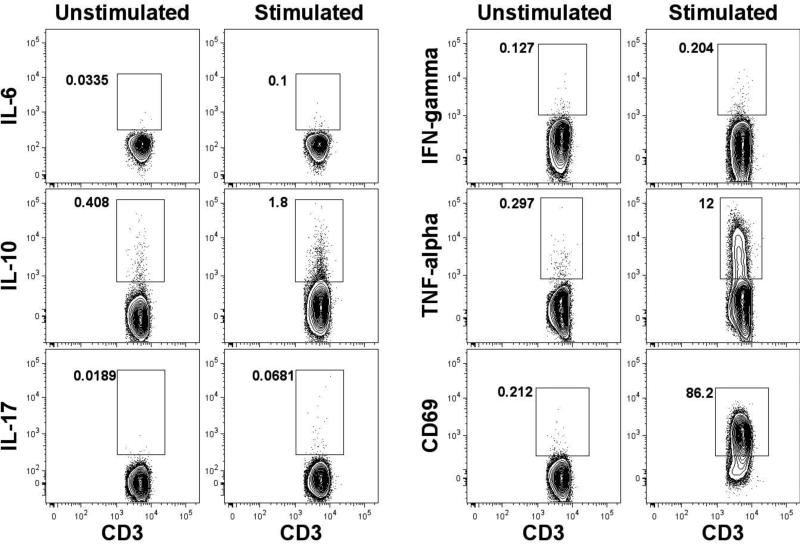
Figure 4. Detection of intracellular cytokine production by non-regulatory T cells.
Umbilical cord blood cells were stimulated using PMA/ionomycin or left un-stimulated, both in the presence of monensin. The flow cytometery gating strategy illustrated in Figure 1 was used to identify the non-T regulatory cells (Dead-Dump- CD3+CD4+CD127+FoxP3-). A gate was then placed to identify the frequency of cytokine producing or activated (CD69+) T cells. Representative data are shown from matched stimulated and un-stimulated patient samples.

