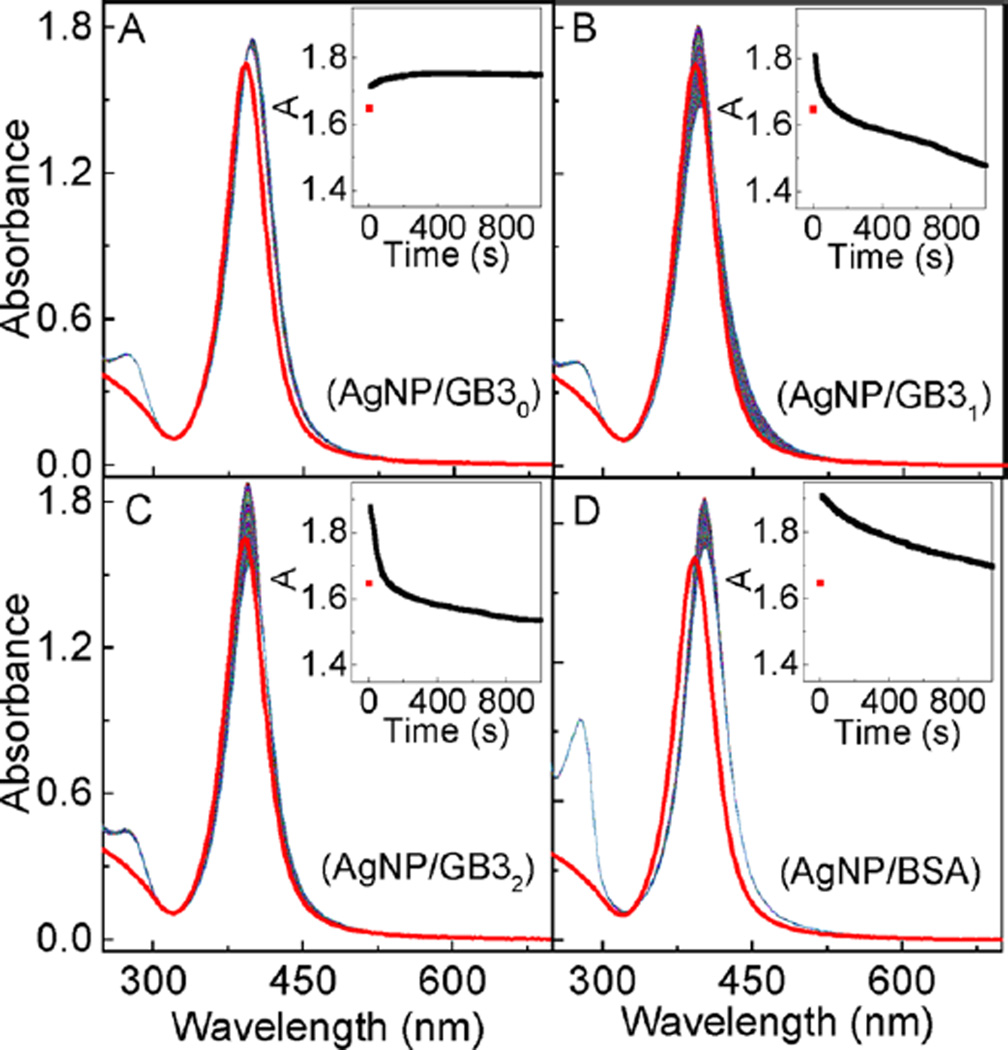
Figure 2.
Time-resolved UV–vis spectra of (A) AgNP/GB30, (B) AgNP/GB31, (C) AgNP/GB32, and (D) AgNP/BSA. The spectrum in red is the AgNP control. Insets are the time course of the peak AgNP UV–vis absorbance as a function of sample incubation time. The nominal concentrations of AgNPs and proteins are 3.9 nM and 10 µM, respectively.

