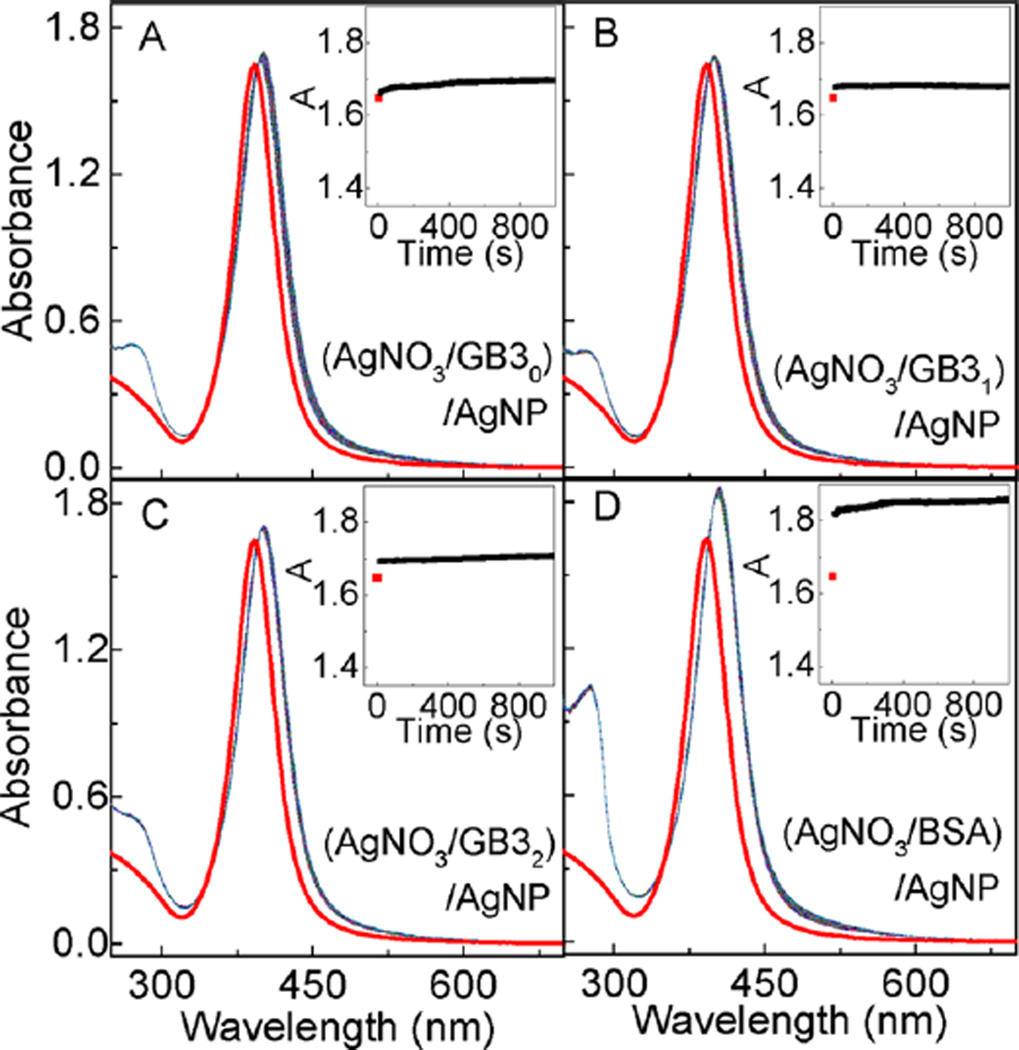
Figure 3.
AgNP interactions with AgNO3-treated proteins. Time-resolved UV–vis spectra of AgNPs mixed with AgNO3 treated (A) GB30, (B) GB31, (C) GB32, and (D) BSA, respectively. Insets are the time course of the AgNP peak UV–vis absorbance. The concentration of GB30, GB31, GB32 and BSA proteins are 60 µM. Ag+/protein ratio was 10/1. AgNO3 and protein were mixed and incubated overnight. Time-resolved UV–vis spectra were obtained immediately after the addition of AgNPs to the AgNO3-treated proteins.

