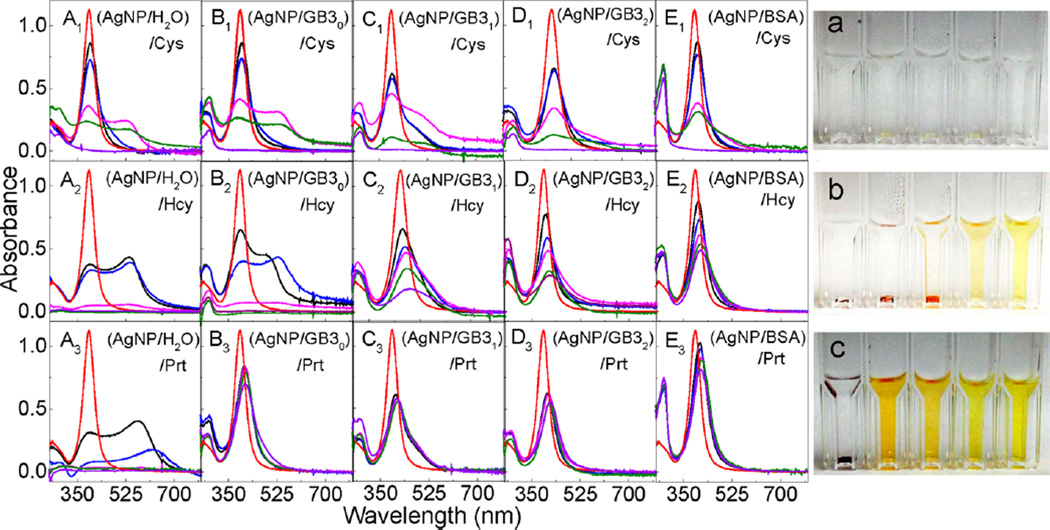
Figure 6.
Sequential protein and organothiol interaction with AgNPs. (Left) Time-dependent UV–vis spectra of (A1–A3) (AgNP/H2O)/organothiol, (B1–B3) (AgNP/GB30)/organothiol, (C1–C3) (AgNP/GB31)/organothiol, (D1–D3) (AgNP/GB32)/OT, and (E1–E3) (AgNP/BSA)/OT. Spectra were obtained (red) 0 min, and (black) 2 min, (blue) 1 h, (magenta) 1day, (green) 3 days, and (purple) 3 weeks after the sample preparation. The concentrations of AgNP, protein, and organothiols were 2.6 nM, 10 µM, and 300 µM, respectively. (Right) Photographs of the AgNPs treated with Cys, Hcy, and Prt, respectively. Cuvettes form left to right corresponding to samples A–E in the same row. Photographs were taken after the samples were left in refrigerator for 3 weeks.

